


Forty-three people went to a canteen, which sells soup and tea. If $ 18 $ persons took soup only, $ 8 $ took tea only and $ 5 $ took nothing. Use a Venn-diagram to find how many took tea.
Answer
524.7k+ views
Hint: First of all, we shall note some important terms from the given question and they are persons, soup and tea.
Here, it is given that a total of forty-three people went to a canteen. Out of forty-three, $ 18 $ persons took soup only (i.e. they took soup not tea). And $ 8 $ took tea only (i.e. they took tea not soup).Also, $ 5 $ persons didn’t take anything (i.e. they didn’t buy soup and tea).
Now, our question is to calculate how many members took tea and also we are asked to represent it in a Venn-diagram. When we use circles to show the relationships among a group of things, this type of illustration is generally known as a Venn-diagram.
Formula used:
\[n(A \cap B) = n(U) - n(A \cap \bar B) - n(\bar A \cap B) - n(\overline {A \cup B} )\]
$ n\left( B \right) = n\left( {A \cap B} \right) + n\left( {\bar A \cap B} \right) $
Complete step by step answer:
Let us name the set of all $ 43 $ persons as\[U\] .
Let \[A\] be the set of all people who took only soup not tea.
Let \[B\] be the set of all people who took only tea, not soup.
We shall denote the above assumptions mathematically using given information.
The total number of persons,
$ n\left( U \right) = 43 $
The number of persons, who took only soup,
$ n\left( {A \cap \bar B} \right) = 18 $
The number of persons, who took only tea,
\[\;\;n\left( {\bar A \cap B} \right) = 8\]
The number of persons, who took nothing,
$ n\left( {\overline {A \cup B} } \right) = 5 $
Now, we need to substitute these values in the first formula.
\[n(A \cap B) = n(U) - n(A \cap \bar B) - n(\bar A \cap B) - n(\overline {A \cup B} )\]
$ = 43 - 18 - 8 - 5 $
$ = 12 $
Using second formula, we get
$ n\left( B \right) = n\left( {A \cap B} \right) + n\left( {\bar A \cap B} \right) $
$ = 12 + 8 $
$ = 20 $
Therefore, $ 20 $ people took tea.
Then, we need to represent it in a Venn-diagram.
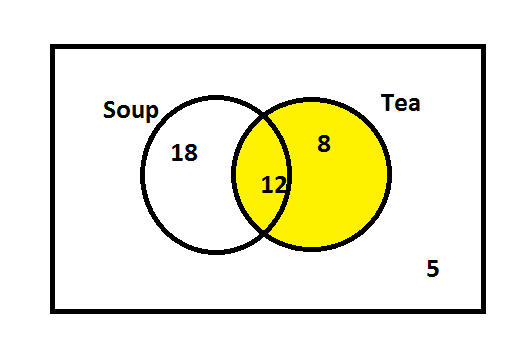
This is the required Venn-diagram.
Note: When we use circles to show the relationships among a group of things, this type of illustration is generally known as a Venn-diagram. Our question is to calculate how many members took tea and also we are asked to represent it in a Venn-diagram. Here, $ 20 $ people took tea.
Here, it is given that a total of forty-three people went to a canteen. Out of forty-three, $ 18 $ persons took soup only (i.e. they took soup not tea). And $ 8 $ took tea only (i.e. they took tea not soup).Also, $ 5 $ persons didn’t take anything (i.e. they didn’t buy soup and tea).
Now, our question is to calculate how many members took tea and also we are asked to represent it in a Venn-diagram. When we use circles to show the relationships among a group of things, this type of illustration is generally known as a Venn-diagram.
Formula used:
\[n(A \cap B) = n(U) - n(A \cap \bar B) - n(\bar A \cap B) - n(\overline {A \cup B} )\]
$ n\left( B \right) = n\left( {A \cap B} \right) + n\left( {\bar A \cap B} \right) $
Complete step by step answer:
Let us name the set of all $ 43 $ persons as\[U\] .
Let \[A\] be the set of all people who took only soup not tea.
Let \[B\] be the set of all people who took only tea, not soup.
We shall denote the above assumptions mathematically using given information.
The total number of persons,
$ n\left( U \right) = 43 $
The number of persons, who took only soup,
$ n\left( {A \cap \bar B} \right) = 18 $
The number of persons, who took only tea,
\[\;\;n\left( {\bar A \cap B} \right) = 8\]
The number of persons, who took nothing,
$ n\left( {\overline {A \cup B} } \right) = 5 $
Now, we need to substitute these values in the first formula.
\[n(A \cap B) = n(U) - n(A \cap \bar B) - n(\bar A \cap B) - n(\overline {A \cup B} )\]
$ = 43 - 18 - 8 - 5 $
$ = 12 $
Using second formula, we get
$ n\left( B \right) = n\left( {A \cap B} \right) + n\left( {\bar A \cap B} \right) $
$ = 12 + 8 $
$ = 20 $
Therefore, $ 20 $ people took tea.
Then, we need to represent it in a Venn-diagram.
This is the required Venn-diagram.
Note: When we use circles to show the relationships among a group of things, this type of illustration is generally known as a Venn-diagram. Our question is to calculate how many members took tea and also we are asked to represent it in a Venn-diagram. Here, $ 20 $ people took tea.
Recently Updated Pages
Master Class 11 Business Studies: Engaging Questions & Answers for Success
Master Class 11 Computer Science: Engaging Questions & Answers for Success
Master Class 11 Economics: Engaging Questions & Answers for Success
Master Class 11 Social Science: Engaging Questions & Answers for Success
Master Class 11 English: Engaging Questions & Answers for Success
Master Class 11 Chemistry: Engaging Questions & Answers for Success
Trending doubts
Draw a diagram of nephron and explain its structur class 11 biology CBSE
Explain zero factorial class 11 maths CBSE
Chemical formula of Bleaching powder is A Ca2OCl2 B class 11 chemistry CBSE
Name the part of the brain responsible for the precision class 11 biology CBSE
The growth of tendril in pea plants is due to AEffect class 11 biology CBSE
One Metric ton is equal to kg A 10000 B 1000 C 100 class 11 physics CBSE