


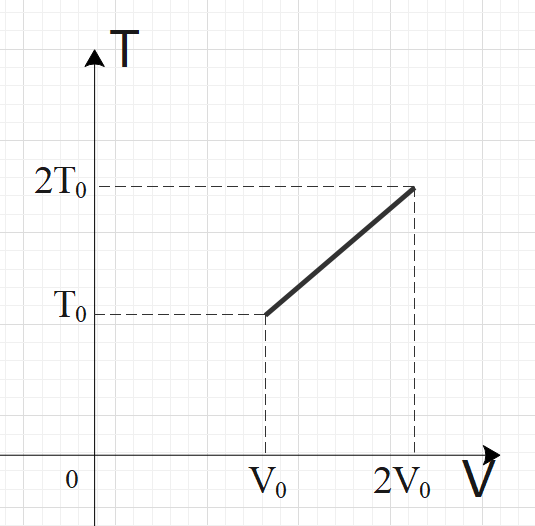
For two thermodynamic processes, temperature and volume diagrams are given. In the first process, it is a straight line having initial and final coordinates as $\left( {{V}_{0}},{{T}_{0}} \right)$and $\left( 2{{V}_{0}},2{{T}_{0}} \right)$, where as in the second process it is a rectangular hyperbola having initial and final coordinates \[\left( {{V}_{0}},{{T}_{0}} \right)\] and \[\left( 2{{V}_{0}},\dfrac{{{T}_{0}}}{2} \right)\]. Then ratio of work done in the two processes must be

a) $1:2$
b) $2:1$
c) $1:1$
d) None of the above
Answer
611.1k+ views
Hint: For an ideal gas, $PV=nRT$ is applicable. In graph-1, we have a straight-line relation between temperature and volume, so we can say by ideal gas relation that pressure is constant in graph-1. For the second graph, we have a rectangular hyperbola relation between temperature and volume, i.e. $TV=C$. From both the relations, get the pressure in terms of temperature and volume. Now, calculate the work done by using the formula: $W=\int\limits_{{{V}_{1}}}^{{{V}_{2}}}{PdV}$ and compare the work done by both the processes to get the required ratio.
Complete step by step answer:

In the first process, we have a straight-line graph, i.e. the slope of the T-V graph is constant.
So, we can say that: $\dfrac{T}{V}=C$
By ideal gas relation, we have: $PV=nRT$
We can also write the ideal gas equation as:
$\dfrac{P}{nR}=\dfrac{T}{V}$
Since $\dfrac{T}{V}=C$, we can say that P is constant.
Now, we need to find the work done by the process 1
As we know that, $W=\int\limits_{{{V}_{1}}}^{{{V}_{2}}}{PdV}$
So, for process-1, we can say: ${{W}_{1}}=\int\limits_{{{V}_{0}}}^{2{{V}_{0}}}{PdV}$
By ideal gas equation, $PV=nRT$
We have:
$PdV=nRdT$
So, we can write work done as:
\[\begin{align}
& {{W}_{1}}=\int\limits_{{{T}_{0}}}^{2{{T}_{0}}}{nRdT} \\
& =nR\left( T \right)_{{{T}_{0}}}^{2{{T}_{0}}} \\
& =nR\left( 2{{T}_{0}}-{{T}_{0}} \right) \\
& =nR{{T}_{0}}
\end{align}\]
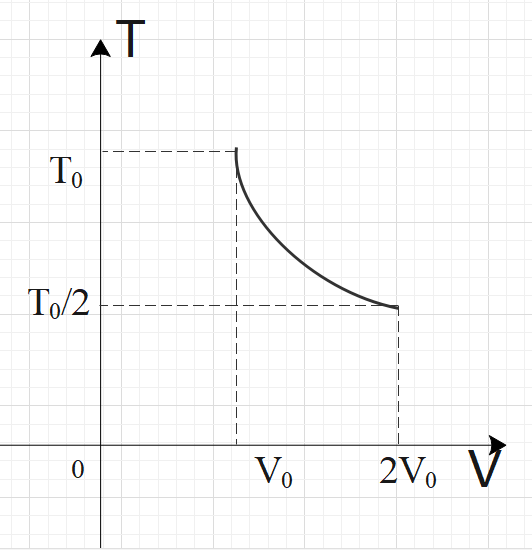
In process-2, we have a rectangular parabola, so we have:$TV=C$
From this result, we can say that: $T=\dfrac{C}{V}$
Now, we know that: $W=\int\limits_{{{V}_{1}}}^{{{V}_{2}}}{PdV}$
So, for process-2, we can say: ${{W}_{2}}=\int\limits_{{{V}_{0}}}^{2{{V}_{0}}}{PdV}$
By ideal gas equation, $PV=nRT$
We have:
$P=\dfrac{nRT}{V}$
So, we can write work done as:
\[\begin{align}
& {{W}_{2}}=\int\limits_{{{V}_{0}}}^{2{{V}_{0}}}{PdV} \\
& =\int\limits_{{{V}_{0}}}^{2{{V}_{0}}}{\dfrac{nRT}{V}dV} \\
& =nRC\int\limits_{2{{V}_{0}}}^{2{{V}_{0}}}{\dfrac{1}{{{V}^{2}}}dV} \\
& =nRC\left( -\dfrac{1}{V} \right)_{2{{V}_{0}}}^{2{{V}_{0}}}
\end{align}\]
So, from graph, we can write:
\[\begin{align}
& {{W}_{2}}=nR\left( -T \right)_{{{T}_{0}}}^{{{T}_{0}}/2} \\
& =nR\left( -\dfrac{{{T}_{0}}}{2}+{{T}_{0}} \right) \\
& =\dfrac{nR{{T}_{0}}}{2}
\end{align}\]
Now, comparing work done by both the processes, we have:
$\begin{align}
& \dfrac{{{W}_{1}}}{{{W}_{2}}}=\dfrac{nR{{T}_{0}}}{\dfrac{nR{{T}_{0}}}{2}} \\
& \dfrac{{{W}_{1}}}{{{W}_{2}}}=\dfrac{2}{1}
\end{align}$
So, the required ratio is $1:2$
So, the correct answer is “Option A”.
Note:
There is an alternate method to solve the graphs. As we know that work done by a function is the area under the PV curve. So, we can convert these graphs into P-V graphs and then find the area under the curve to get work done.
Complete step by step answer:
In the first process, we have a straight-line graph, i.e. the slope of the T-V graph is constant.
So, we can say that: $\dfrac{T}{V}=C$
By ideal gas relation, we have: $PV=nRT$
We can also write the ideal gas equation as:
$\dfrac{P}{nR}=\dfrac{T}{V}$
Since $\dfrac{T}{V}=C$, we can say that P is constant.
Now, we need to find the work done by the process 1
As we know that, $W=\int\limits_{{{V}_{1}}}^{{{V}_{2}}}{PdV}$
So, for process-1, we can say: ${{W}_{1}}=\int\limits_{{{V}_{0}}}^{2{{V}_{0}}}{PdV}$
By ideal gas equation, $PV=nRT$
We have:
$PdV=nRdT$
So, we can write work done as:
\[\begin{align}
& {{W}_{1}}=\int\limits_{{{T}_{0}}}^{2{{T}_{0}}}{nRdT} \\
& =nR\left( T \right)_{{{T}_{0}}}^{2{{T}_{0}}} \\
& =nR\left( 2{{T}_{0}}-{{T}_{0}} \right) \\
& =nR{{T}_{0}}
\end{align}\]
In process-2, we have a rectangular parabola, so we have:$TV=C$
From this result, we can say that: $T=\dfrac{C}{V}$
Now, we know that: $W=\int\limits_{{{V}_{1}}}^{{{V}_{2}}}{PdV}$
So, for process-2, we can say: ${{W}_{2}}=\int\limits_{{{V}_{0}}}^{2{{V}_{0}}}{PdV}$
By ideal gas equation, $PV=nRT$
We have:
$P=\dfrac{nRT}{V}$
So, we can write work done as:
\[\begin{align}
& {{W}_{2}}=\int\limits_{{{V}_{0}}}^{2{{V}_{0}}}{PdV} \\
& =\int\limits_{{{V}_{0}}}^{2{{V}_{0}}}{\dfrac{nRT}{V}dV} \\
& =nRC\int\limits_{2{{V}_{0}}}^{2{{V}_{0}}}{\dfrac{1}{{{V}^{2}}}dV} \\
& =nRC\left( -\dfrac{1}{V} \right)_{2{{V}_{0}}}^{2{{V}_{0}}}
\end{align}\]
So, from graph, we can write:
\[\begin{align}
& {{W}_{2}}=nR\left( -T \right)_{{{T}_{0}}}^{{{T}_{0}}/2} \\
& =nR\left( -\dfrac{{{T}_{0}}}{2}+{{T}_{0}} \right) \\
& =\dfrac{nR{{T}_{0}}}{2}
\end{align}\]
Now, comparing work done by both the processes, we have:
$\begin{align}
& \dfrac{{{W}_{1}}}{{{W}_{2}}}=\dfrac{nR{{T}_{0}}}{\dfrac{nR{{T}_{0}}}{2}} \\
& \dfrac{{{W}_{1}}}{{{W}_{2}}}=\dfrac{2}{1}
\end{align}$
So, the required ratio is $1:2$
So, the correct answer is “Option A”.
Note:
There is an alternate method to solve the graphs. As we know that work done by a function is the area under the PV curve. So, we can convert these graphs into P-V graphs and then find the area under the curve to get work done.
Recently Updated Pages
Master Class 12 Economics: Engaging Questions & Answers for Success
Master Class 12 English: Engaging Questions & Answers for Success
Master Class 12 Social Science: Engaging Questions & Answers for Success
Master Class 12 Maths: Engaging Questions & Answers for Success
Master Class 12 Physics: Engaging Questions & Answers for Success
Master Class 12 Business Studies: Engaging Questions & Answers for Success
Trending doubts
Which are the Top 10 Largest Countries of the World?
Draw a labelled sketch of the human eye class 12 physics CBSE
Differentiate between homogeneous and heterogeneous class 12 chemistry CBSE
Why is the cell called the structural and functional class 12 biology CBSE
Draw ray diagrams each showing i myopic eye and ii class 12 physics CBSE
Which is the correct genotypic ratio of mendel dihybrid class 12 biology CBSE