


For numeric series, $M = \left\{ {1;45;23;34;9} \right\}$, find: Average Quadratic deviation.
Answer
592.8k+ views
Hint:First, we will arrange the given series in ascending order and note down the number of data points. The average Quadratic deviation can be calculated using the Arithmetic Mean of the data as given in the series. We will use the number of terms in the series, i.e., the number of data points in the series to calculate the Arithmetic Mean.
Complete step-by-step answer:
We are given a numeric series in the problem which is given by
$M = \left\{ {1;45;23;34;9} \right\}$
Before going further, we will sort the data given and then further calculations will be done.
Sorted series - $1;9;23;34;45$
Number of data points, $n = 5$
We will now calculate the Arithmetic Mean in order to evaluate the average Quadratic deviation.
Let us write down the data in symbolic form to make it easy for us to proceed:
The first term of the sorted series $ = {x_1} = 1$
The second term of the sorted series $ = {x_2} = 9$
The third term of the sorted series $ = {x_3} = 23$
The fourth term of the sorted series $ = {x_4} = 34$
The fifth term of the sorted series $ = {x_5} = 45$
The arithmetic mean is given by the formula:
$\bar x = \dfrac{{{x_1} + ... + {x_{_n}}}}{n}$
Putting the values in the above equation,
$\bar x = \dfrac{{1 + 9 + 23 + 34 + 45}}{5} = \dfrac{{112}}{5} = 22.4$
Thus, arithmetic mean $ = \bar x = 22.4$
Now, we will calculate the difference between each of the data points in the sorted series and the arithmetic mean calculated. For ease, we are tabulating the process:
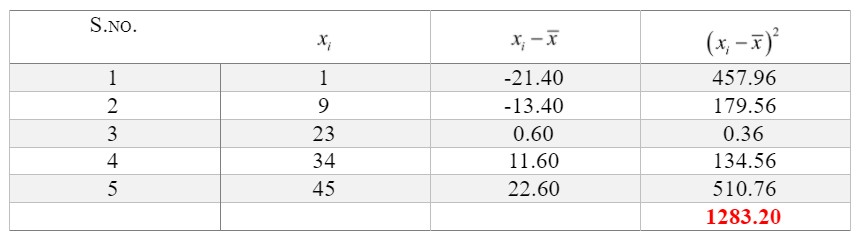
The average Quadratic deviation is square root of the mean squared deviation and is given as:
$\sigma = \sqrt {\dfrac{{\sum\limits_{i = 1}^n {{{\left( {{x_i} - \bar x} \right)}^2}} }}{n}} = \sqrt {\dfrac{{{{\left( {{x_1} - \bar x} \right)}^2} + {{\left( {{x_2} - \bar x} \right)}^2} + ... + {{\left( {{x_n} - \bar x} \right)}^2}}}{n}} $
Using the table, we have found out the value of $\sum\limits_{i = 1}^n {{{\left( {{x_i} - \bar x} \right)}^2}} $= 1283.20
Thus, $\sigma = \sqrt {\dfrac{{1283.20}}{5}} = \sqrt {256.64} = 16.02$
Note:By the use of Mean, Median and Mode, our approach was more of a concentration of data not caring much about the extremes of our distribution. Average Quadratic deviation, also referred to as Standard Deviation, is a measure of dispersion of data.
When we are interested in the estimating the spread of a distribution about an estimate of the central tendencies (mostly, the Mean), the answer is Average Quadratic Deviation. It gives us some sort of idea about the expanse about the measures of central tendency (usually, mean).
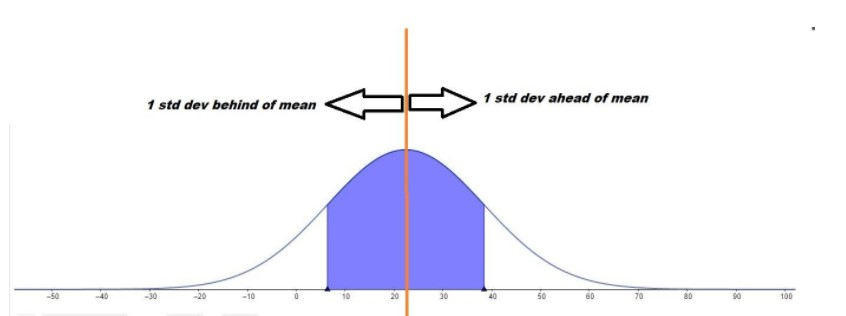
This will be clear by taking the example of a probabilistic Model,i.e., the Gaussian (Normal) Distribution as indicated below:
Higher the Average Quadratic Deviation, narrower is the curve, i.e. more data is centralised towards mean.
Complete step-by-step answer:
We are given a numeric series in the problem which is given by
$M = \left\{ {1;45;23;34;9} \right\}$
Before going further, we will sort the data given and then further calculations will be done.
Sorted series - $1;9;23;34;45$
Number of data points, $n = 5$
We will now calculate the Arithmetic Mean in order to evaluate the average Quadratic deviation.
Let us write down the data in symbolic form to make it easy for us to proceed:
The first term of the sorted series $ = {x_1} = 1$
The second term of the sorted series $ = {x_2} = 9$
The third term of the sorted series $ = {x_3} = 23$
The fourth term of the sorted series $ = {x_4} = 34$
The fifth term of the sorted series $ = {x_5} = 45$
The arithmetic mean is given by the formula:
$\bar x = \dfrac{{{x_1} + ... + {x_{_n}}}}{n}$
Putting the values in the above equation,
$\bar x = \dfrac{{1 + 9 + 23 + 34 + 45}}{5} = \dfrac{{112}}{5} = 22.4$
Thus, arithmetic mean $ = \bar x = 22.4$
Now, we will calculate the difference between each of the data points in the sorted series and the arithmetic mean calculated. For ease, we are tabulating the process:
The average Quadratic deviation is square root of the mean squared deviation and is given as:
$\sigma = \sqrt {\dfrac{{\sum\limits_{i = 1}^n {{{\left( {{x_i} - \bar x} \right)}^2}} }}{n}} = \sqrt {\dfrac{{{{\left( {{x_1} - \bar x} \right)}^2} + {{\left( {{x_2} - \bar x} \right)}^2} + ... + {{\left( {{x_n} - \bar x} \right)}^2}}}{n}} $
Using the table, we have found out the value of $\sum\limits_{i = 1}^n {{{\left( {{x_i} - \bar x} \right)}^2}} $= 1283.20
Thus, $\sigma = \sqrt {\dfrac{{1283.20}}{5}} = \sqrt {256.64} = 16.02$
Note:By the use of Mean, Median and Mode, our approach was more of a concentration of data not caring much about the extremes of our distribution. Average Quadratic deviation, also referred to as Standard Deviation, is a measure of dispersion of data.
When we are interested in the estimating the spread of a distribution about an estimate of the central tendencies (mostly, the Mean), the answer is Average Quadratic Deviation. It gives us some sort of idea about the expanse about the measures of central tendency (usually, mean).
This will be clear by taking the example of a probabilistic Model,i.e., the Gaussian (Normal) Distribution as indicated below:
Higher the Average Quadratic Deviation, narrower is the curve, i.e. more data is centralised towards mean.
Recently Updated Pages
Master Class 11 Computer Science: Engaging Questions & Answers for Success
Master Class 11 Business Studies: Engaging Questions & Answers for Success
Master Class 11 Economics: Engaging Questions & Answers for Success
Master Class 11 English: Engaging Questions & Answers for Success
Master Class 11 Maths: Engaging Questions & Answers for Success
Master Class 11 Biology: Engaging Questions & Answers for Success
Trending doubts
One Metric ton is equal to kg A 10000 B 1000 C 100 class 11 physics CBSE
There are 720 permutations of the digits 1 2 3 4 5 class 11 maths CBSE
Discuss the various forms of bacteria class 11 biology CBSE
Draw a diagram of a plant cell and label at least eight class 11 biology CBSE
State the laws of reflection of light
Explain zero factorial class 11 maths CBSE