


Find the range of function f(x) where f(x) = ${{e}^{x}}$ in [0, 1].
Answer
638.1k+ views
Hint: We have to first check the continuity of the function in the given interval. Then we have to find the limits of the function at its extreme intervals.
Complete step-by-step answer:
So here we are given a function ${{e}^{x}}$ in [0, 1] and we have to find its range.
First we need to find if this function is continuous in [0, 1].
f (x) = ${{e}^{x}}$
f (0) = ${{e}^{0}}$
= 1
f (1) =${{e}^{1}}$
= e
As the limits exist in the interval and there are no corner points where the function becomes discontinuous, we can say that the function is continuous in the interval [0, 1].
Here the function f(x) = ${{e}^{x}}$ is increasing in nature, which means f(x+1)>f(x).
So f(1) > f(0)
f (0) = ${{e}^{0}}$
= 1
f (1) =${{e}^{1}}$
= e
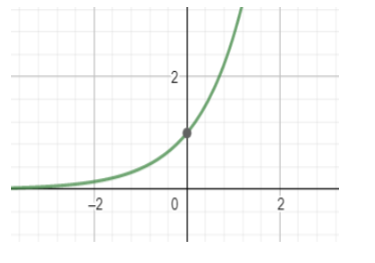
This is the graph of ${{e}^{x}}$. We can see that the function tends to 0 when x tends to -∞. And when x tends to ∞ then the function ${{e}^{x}}$ also tends to infinity. It intersects the y axis at the point (0,1) which means when the value of x = 0 , then the value of the function is 1.
We can see this is an increasing function and it is continuous in the interval [0, 1].
Therefore the range of the function f(x) = ${{e}^{x}}$ is [0, 1]
Note: We must remember the graphs of ${{e}^{x}}$ and ${{e}^{-x}}$ as they are very much important for boards as well as competitive exams. Where ${{e}^{x}}$ is always increasing in nature and on the other hand ${{e}^{-x}}$ is always decreasing in nature. They are also called exponential graphs, which are used to model populations.
Complete step-by-step answer:
So here we are given a function ${{e}^{x}}$ in [0, 1] and we have to find its range.
First we need to find if this function is continuous in [0, 1].
f (x) = ${{e}^{x}}$
f (0) = ${{e}^{0}}$
= 1
f (1) =${{e}^{1}}$
= e
As the limits exist in the interval and there are no corner points where the function becomes discontinuous, we can say that the function is continuous in the interval [0, 1].
Here the function f(x) = ${{e}^{x}}$ is increasing in nature, which means f(x+1)>f(x).
So f(1) > f(0)
f (0) = ${{e}^{0}}$
= 1
f (1) =${{e}^{1}}$
= e
This is the graph of ${{e}^{x}}$. We can see that the function tends to 0 when x tends to -∞. And when x tends to ∞ then the function ${{e}^{x}}$ also tends to infinity. It intersects the y axis at the point (0,1) which means when the value of x = 0 , then the value of the function is 1.
We can see this is an increasing function and it is continuous in the interval [0, 1].
Therefore the range of the function f(x) = ${{e}^{x}}$ is [0, 1]
Note: We must remember the graphs of ${{e}^{x}}$ and ${{e}^{-x}}$ as they are very much important for boards as well as competitive exams. Where ${{e}^{x}}$ is always increasing in nature and on the other hand ${{e}^{-x}}$ is always decreasing in nature. They are also called exponential graphs, which are used to model populations.
Recently Updated Pages
Master Class 11 Social Science: Engaging Questions & Answers for Success
Master Class 11 Physics: Engaging Questions & Answers for Success
Master Class 11 Maths: Engaging Questions & Answers for Success
Master Class 11 Economics: Engaging Questions & Answers for Success
Master Class 11 Computer Science: Engaging Questions & Answers for Success
Master Class 11 Chemistry: Engaging Questions & Answers for Success
Trending doubts
One Metric ton is equal to kg A 10000 B 1000 C 100 class 11 physics CBSE
There are 720 permutations of the digits 1 2 3 4 5 class 11 maths CBSE
1 Quintal is equal to a 110 kg b 10 kg c 100kg d 1000 class 11 physics CBSE
State and prove Bernoullis theorem class 11 physics CBSE
Difference Between Prokaryotic Cells and Eukaryotic Cells
Which among the following are examples of coming together class 11 social science CBSE