


How do you draw the graph for \[y=-cotx\] for \[0\le x\le 2\pi \] ?
Answer
577.8k+ views
Hint: First of all, we will see in which quadrant value of cotangent is positive and in which quadrant, it is negative. Then we can just reverse the quadrants for \[-cot\text{ }x\] to check where positive values lie and where negative. Then we will plot the x-y graph, where the x-axis will represent the angle in radians while the y-axis will denote the value of the function. The value of \[x\] lies between $0$ and $2\pi $ so the x-quadrant will contain an angle between them. The range of the function is \[cotx<-1\] or \[cotx>1\].
Then \[-cotx>1\] or \[-cotx\text{ }<-1\]. This implies \[y>1\] or \[y<1\].
Complete step by step solution:
We have to plot the graph of \[-cot\text{ }x\]
For this we should have the value of \[cot\text{ }x\] in the given domain \[\left[ 0,2\pi \right]\].
We know that cot gives positive values in the first and fourth quadrant and negative values in the second and third quadrant.
So, -cot will give negative values in the first and fourth quadrant and positive values in the second and third quadrant.
The cycle changes after $\pi $ radians. So, there is one cycle between $0$ and $\pi $, another between $\pi $ and $2\pi $ and so on.
Every cycle has vertical asymptotes at the end of the cycle.
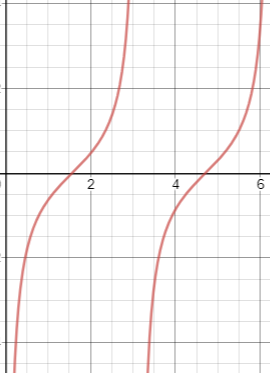
The value of cot in each cycle is decreasing so \[-cot\text{ }x\] will have increasing values in each cycle.
So , keeping all these points in mind , we plot the following graph:
Note:
The asymptotes of \[\text{cot }x\] are the x-intercepts of the function \[\text{tan }x\]. While the asymptotes of \[\text{tan }x\] is the x-intercept of the function \[\text{cot }x\].
Then \[-cotx>1\] or \[-cotx\text{ }<-1\]. This implies \[y>1\] or \[y<1\].
Complete step by step solution:
We have to plot the graph of \[-cot\text{ }x\]
For this we should have the value of \[cot\text{ }x\] in the given domain \[\left[ 0,2\pi \right]\].
We know that cot gives positive values in the first and fourth quadrant and negative values in the second and third quadrant.
So, -cot will give negative values in the first and fourth quadrant and positive values in the second and third quadrant.
The cycle changes after $\pi $ radians. So, there is one cycle between $0$ and $\pi $, another between $\pi $ and $2\pi $ and so on.
Every cycle has vertical asymptotes at the end of the cycle.
The value of cot in each cycle is decreasing so \[-cot\text{ }x\] will have increasing values in each cycle.
So , keeping all these points in mind , we plot the following graph:
Note:
The asymptotes of \[\text{cot }x\] are the x-intercepts of the function \[\text{tan }x\]. While the asymptotes of \[\text{tan }x\] is the x-intercept of the function \[\text{cot }x\].
Recently Updated Pages
Master Class 11 English: Engaging Questions & Answers for Success
Master Class 11 Maths: Engaging Questions & Answers for Success
Class 11 Question and Answer - Your Ultimate Solutions Guide
Master Class 11 Biology: Engaging Questions & Answers for Success
Master Class 11 Physics: Engaging Questions & Answers for Success
Master Class 11 Accountancy: Engaging Questions & Answers for Success
Trending doubts
Differentiate between an exothermic and an endothermic class 11 chemistry CBSE
One Metric ton is equal to kg A 10000 B 1000 C 100 class 11 physics CBSE
Difference Between Prokaryotic Cells and Eukaryotic Cells
There are 720 permutations of the digits 1 2 3 4 5 class 11 maths CBSE
Draw a diagram of a plant cell and label at least eight class 11 biology CBSE
1 Quintal is equal to a 110 kg b 10 kg c 100kg d 1000 class 11 physics CBSE