


Draw a rough sketch of the graph of the function \[x = 5y\]?
Answer
577.5k+ views
Hint: We need to draw the graph ‘x’ versus ‘y’. Normally we give the random values for ‘x’ and we find the value of ‘y’. If we give all the real number values of ‘x’ we will get a decimal point of ‘y’ which is difficult to point out the coordinate in the graph. So we give all the real values for ‘y’ and we find the ‘x’ values. Thus we will have coordinate points (x, y). Hence, we can plot the graph by using the values. We can also draw the graph using the intercept method. But here we have a function which is passing through origin. So we use tables to draw the graph.
Complete step-by-step solution:
Given \[x = 5y\].
Let's give the values for ‘y’ and we find the value of ‘x’.
Put \[y = 1\]in \[x = 5y\] we have,
\[x = 5 \times 1 = 5\]
Thus we have coordinate points \[(5,1)\].
Put \[y = - 1\]in \[x = 5y\] we have,
\[x = 5 \times ( - 1) = - 5\]
Thus we have coordinate point \[( - 5, - 1)\].
Put \[y = 2\]in \[x = 5y\] we have,
\[x = 5 \times 2 = 10\]
Thus we have coordinate points \[(10,2)\].
Put \[y = - 2\]in \[x = 5y\] we have,
\[x = 5 \times ( - 2) = - 10\]
Thus we have coordinate point \[( - 10, - 2)\].
Put \[y = 3\]in \[x = 5y\] we have,
\[x = 5 \times 3 = 15\]
Thus we have coordinate points \[(15,3)\].
Put \[y = - 3\]in \[x = 5y\] we have,
\[x = 5 \times \left( { - 3} \right) = - 15\]
Thus we have coordinate point \[( - 15, - 3)\].
Put \[y = 4\]in \[x = 5y\] we have,
\[x = 5 \times 4 = 20\]
Thus we have coordinate points \[(20,4)\].
Put \[y = - 4\]in \[x = 5y\] we have,
\[x = 5 \times \left( { - 4} \right) = - 20\]
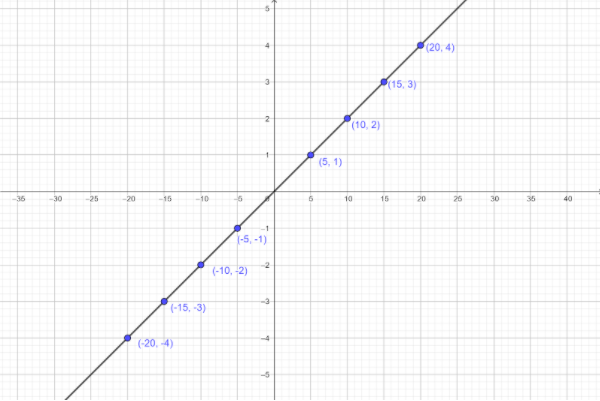
Thus we have coordinate point \[( - 20, - 4)\]Thus we have,
Let’s draw the graph for these coordinates,
Here we take x-axis = 1 unit =5 units
y-axis = 1 unit =1 unit.
Note: We can see that the given curve is parabola. A graph shows the relation between two variable quantities, it contains two axes perpendicular to each other namely the x-axis and the y-axis. Each variable is measured along one of the axes. In the question, we are given one linear equation containing two variables namely x and y, x is measured along the x-axis and y is measured along the y-axis while tracing the given equations.
Complete step-by-step solution:
Given \[x = 5y\].
Let's give the values for ‘y’ and we find the value of ‘x’.
Put \[y = 1\]in \[x = 5y\] we have,
\[x = 5 \times 1 = 5\]
Thus we have coordinate points \[(5,1)\].
Put \[y = - 1\]in \[x = 5y\] we have,
\[x = 5 \times ( - 1) = - 5\]
Thus we have coordinate point \[( - 5, - 1)\].
Put \[y = 2\]in \[x = 5y\] we have,
\[x = 5 \times 2 = 10\]
Thus we have coordinate points \[(10,2)\].
Put \[y = - 2\]in \[x = 5y\] we have,
\[x = 5 \times ( - 2) = - 10\]
Thus we have coordinate point \[( - 10, - 2)\].
Put \[y = 3\]in \[x = 5y\] we have,
\[x = 5 \times 3 = 15\]
Thus we have coordinate points \[(15,3)\].
Put \[y = - 3\]in \[x = 5y\] we have,
\[x = 5 \times \left( { - 3} \right) = - 15\]
Thus we have coordinate point \[( - 15, - 3)\].
Put \[y = 4\]in \[x = 5y\] we have,
\[x = 5 \times 4 = 20\]
Thus we have coordinate points \[(20,4)\].
Put \[y = - 4\]in \[x = 5y\] we have,
\[x = 5 \times \left( { - 4} \right) = - 20\]
Thus we have coordinate point \[( - 20, - 4)\]Thus we have,
| \[x\] | \[5\] | \[ - 5\] | \[10\] | \[ - 10\] | \[15\] | \[ - 15\] | \[20\] | \[ - 20\] |
| \[y\] | \[1\] | \[ - 1\] | \[2\] | \[ - 2\] | \[3\] | \[ - 3\] | \[4\] | \[ - 4\] |
Let’s draw the graph for these coordinates,
Here we take x-axis = 1 unit =5 units
y-axis = 1 unit =1 unit.
Note: We can see that the given curve is parabola. A graph shows the relation between two variable quantities, it contains two axes perpendicular to each other namely the x-axis and the y-axis. Each variable is measured along one of the axes. In the question, we are given one linear equation containing two variables namely x and y, x is measured along the x-axis and y is measured along the y-axis while tracing the given equations.
Recently Updated Pages
Master Class 11 English: Engaging Questions & Answers for Success
Master Class 11 Maths: Engaging Questions & Answers for Success
Class 11 Question and Answer - Your Ultimate Solutions Guide
Master Class 11 Biology: Engaging Questions & Answers for Success
Master Class 11 Physics: Engaging Questions & Answers for Success
Master Class 11 Accountancy: Engaging Questions & Answers for Success
Trending doubts
Differentiate between an exothermic and an endothermic class 11 chemistry CBSE
One Metric ton is equal to kg A 10000 B 1000 C 100 class 11 physics CBSE
Difference Between Prokaryotic Cells and Eukaryotic Cells
There are 720 permutations of the digits 1 2 3 4 5 class 11 maths CBSE
Draw a diagram of a plant cell and label at least eight class 11 biology CBSE
1 Quintal is equal to a 110 kg b 10 kg c 100kg d 1000 class 11 physics CBSE