


Do you agree with the statement? Give reasons
There is only one type of diagram.
Answer
528.6k+ views
Hint: A diagram is a symbolic representation of information using visualization techniques. Diagrams can be classified based on shape and activity. In statistics, diagrams or charts are classified as simple bar chart, multiple bar chart or cluster chart, stacked bar chart or sub-divided bar chart or component bar chart, simple component bar chart, percentage component bar chart, subdivided rectangular bar chart and pie chart.
Complete step-by-step solution:
We know that there are many type of diagrams which are two-dimensional figures. A diagram is a symbolic representation of information using visualization techniques. We can classify diagrams based on shape as block, cycle, cluster, ladder, network, round, spiral, timeline, tree and triangular. We can also classify diagrams based on concept as activity, comparison, decision, explanatory, flow, phase, state, process and timing.
In statistics, diagrams or charts are classified as simple bar chart, multiple bar chart or cluster chart, stacked bar chart or sub-divided bar chart or component bar chart, simple component bar chart, percentage component bar chart, subdivided rectangular bar chart and pie chart.
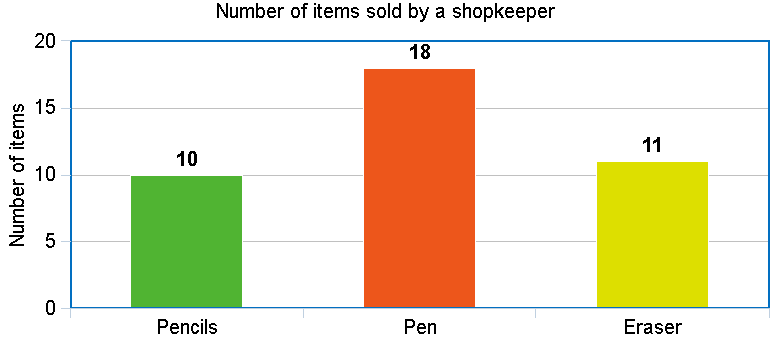
We can define a bar chart or bar graph as a chart or graph that presents categorical data with rectangular bars with heights or lengths proportional to the values that they represent. An example of a bar diagram is shown below.
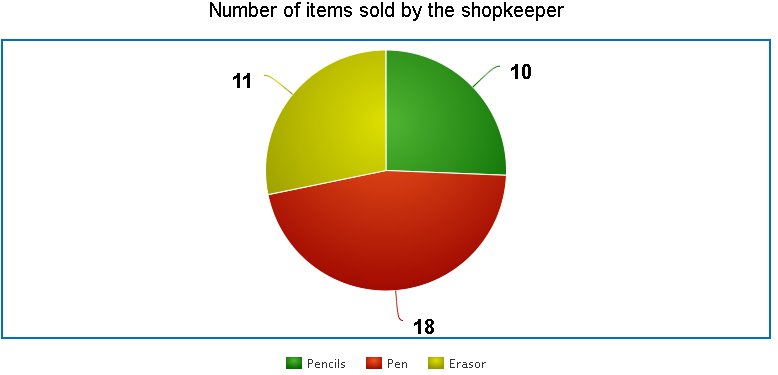
We can define a pie chart as a circular statistical graphic, which is divided into slices to illustrate numerical proportion. In a pie chart, the arc length of each slice, is proportional to the quantity it represents. An example of a pie chart is shown below.
Therefore, there is more than one type of diagram. Hence, the given statement is incorrect.
Note: There are many types of diagrams or charts in statistics that are used to compare things. Another interesting diagram is the Venn diagram that we use to show the relationships among things or finite groups of things. We mainly use Venn diagrams in sets to show the relationship between two sets.
Complete step-by-step solution:
We know that there are many type of diagrams which are two-dimensional figures. A diagram is a symbolic representation of information using visualization techniques. We can classify diagrams based on shape as block, cycle, cluster, ladder, network, round, spiral, timeline, tree and triangular. We can also classify diagrams based on concept as activity, comparison, decision, explanatory, flow, phase, state, process and timing.
In statistics, diagrams or charts are classified as simple bar chart, multiple bar chart or cluster chart, stacked bar chart or sub-divided bar chart or component bar chart, simple component bar chart, percentage component bar chart, subdivided rectangular bar chart and pie chart.
We can define a bar chart or bar graph as a chart or graph that presents categorical data with rectangular bars with heights or lengths proportional to the values that they represent. An example of a bar diagram is shown below.
We can define a pie chart as a circular statistical graphic, which is divided into slices to illustrate numerical proportion. In a pie chart, the arc length of each slice, is proportional to the quantity it represents. An example of a pie chart is shown below.
Therefore, there is more than one type of diagram. Hence, the given statement is incorrect.
Note: There are many types of diagrams or charts in statistics that are used to compare things. Another interesting diagram is the Venn diagram that we use to show the relationships among things or finite groups of things. We mainly use Venn diagrams in sets to show the relationship between two sets.
Recently Updated Pages
Basicity of sulphurous acid and sulphuric acid are
Master Class 10 English: Engaging Questions & Answers for Success
Master Class 10 Social Science: Engaging Questions & Answers for Success
Master Class 10 Computer Science: Engaging Questions & Answers for Success
Class 10 Question and Answer - Your Ultimate Solutions Guide
Master Class 10 General Knowledge: Engaging Questions & Answers for Success
Trending doubts
Who is known as the "Little Master" in Indian cricket history?
A boat goes 24 km upstream and 28 km downstream in class 10 maths CBSE
Who Won 36 Oscar Awards? Record Holder Revealed
Why is there a time difference of about 5 hours between class 10 social science CBSE
Explain the Treaty of Vienna of 1815 class 10 social science CBSE
What is the median of the first 10 natural numbers class 10 maths CBSE