


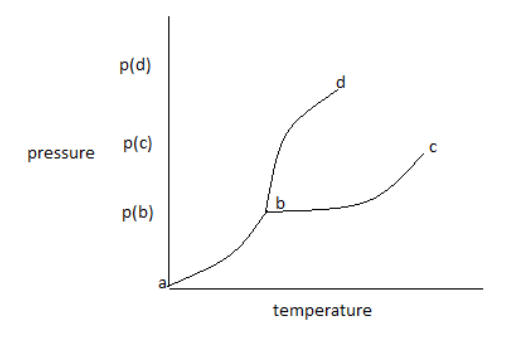
Curve bd is representing which of the following phase changes?
A. Evaporation
B. Sublimation
C. Condensation
D. Melting
E. Boiling
Answer
590.4k+ views
Hint: The phase diagram of one component shows the temperature and pressure for the conversion of different phases into each other. We can determine the phase change by going from left of the curve to right of the curve. The solid phase is present at the left of the bd curve and the liquid phase is present at the right of the bd curve.
Complete Step by step answer: The temperature and pressure at which all three phases coexist is known as triplet point. Triplet point is unique for every substance.
The phase diagram shows the temperature and pressure conditions for the conversion of different phases into each other and the triple point at which all the phases coexist. The phase diagram is plotted between temperature and pressure.
The given phase diagram is for one component system.
The phase diagram contains areas, curves, and triplet points.
In the above phase diagram, area A is for the solid phase, area B is for the liquid phase and area C is for the gas phase. Area shows the existence of one phase only in a temperature and pressure value. On changing, temperature and pressure in the area phase does not change.
Curve ‘bd’ represents the fusion curve, curve ‘cd’ represents the vaporization curve and curve ‘ab’ represents the sublimation curve. The curve shows the existence of two phases at equilibrium at the temperature and pressure values. Any temperature and pressure values at the curve, two phases coexist.
The fusion curve shows the conversion of solid to liquid. So, the substance is melting.
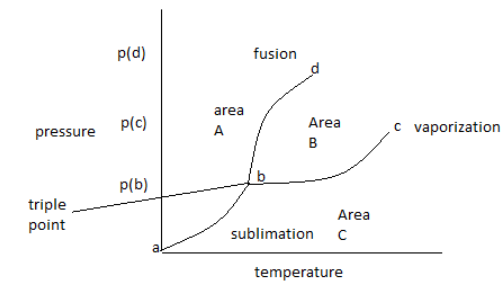
Therefore, option (D) melting is correct.
Note: Triplet point can be identified in the diagram as the point at which three curves join each other. At a triplet point all three phases’ remains in equilibrium. The vaporization curve shows the conversion of liquid to gas. So, the substance is boiling. The sublimation curve shows conversion of solid to gas. So, the substance is evaporating.
Complete Step by step answer: The temperature and pressure at which all three phases coexist is known as triplet point. Triplet point is unique for every substance.
The phase diagram shows the temperature and pressure conditions for the conversion of different phases into each other and the triple point at which all the phases coexist. The phase diagram is plotted between temperature and pressure.
The given phase diagram is for one component system.
The phase diagram contains areas, curves, and triplet points.
In the above phase diagram, area A is for the solid phase, area B is for the liquid phase and area C is for the gas phase. Area shows the existence of one phase only in a temperature and pressure value. On changing, temperature and pressure in the area phase does not change.
Curve ‘bd’ represents the fusion curve, curve ‘cd’ represents the vaporization curve and curve ‘ab’ represents the sublimation curve. The curve shows the existence of two phases at equilibrium at the temperature and pressure values. Any temperature and pressure values at the curve, two phases coexist.
The fusion curve shows the conversion of solid to liquid. So, the substance is melting.
Therefore, option (D) melting is correct.
Note: Triplet point can be identified in the diagram as the point at which three curves join each other. At a triplet point all three phases’ remains in equilibrium. The vaporization curve shows the conversion of liquid to gas. So, the substance is boiling. The sublimation curve shows conversion of solid to gas. So, the substance is evaporating.
Recently Updated Pages
Master Class 11 Social Science: Engaging Questions & Answers for Success
Master Class 11 Physics: Engaging Questions & Answers for Success
Master Class 11 Maths: Engaging Questions & Answers for Success
Master Class 11 Economics: Engaging Questions & Answers for Success
Master Class 11 Computer Science: Engaging Questions & Answers for Success
Master Class 11 Chemistry: Engaging Questions & Answers for Success
Trending doubts
One Metric ton is equal to kg A 10000 B 1000 C 100 class 11 physics CBSE
There are 720 permutations of the digits 1 2 3 4 5 class 11 maths CBSE
1 Quintal is equal to a 110 kg b 10 kg c 100kg d 1000 class 11 physics CBSE
State and prove Bernoullis theorem class 11 physics CBSE
Difference Between Prokaryotic Cells and Eukaryotic Cells
Which among the following are examples of coming together class 11 social science CBSE