


Area bounded by $y = {e^x}$ and lines x=0 and y=e is given by:
(This question has multiple correct options)
A. $e - \int\limits_0^1 {{e^x}dx} $
B. $e - \int\limits_1^e {\ln ydy} $
C. $e - 1$
D. $1$
Answer
619.5k+ views
Hint: To solve this question, we need to know the basic theory related to the area under a curve. As we know the area under a curve that exists between two points can be calculated by conducting a definite integral between the two points. Here we have a curve $y = {e^x}$. First, we will shade the region which consists of Area bounded by $y = {e^x}$ and lines x=0 and y=e as shown below and then after apply definite integral between the two points.
Complete step-by-step answer:
As we know, the area under the curve y = f(x) between x = a & x = b, one must integrate y = f(x) between the limits of a and b.
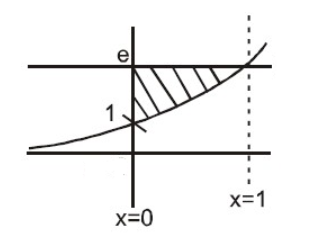
In the above figure, Area bounded by $y = {e^x}$ and lines x=0 and y=e is represented as a shaded region of the graph.
From figure we conclude that-
In the graph, the upper curve will be y = e and the lower one will be $y = {e^x}$.
Required area is,
A = $\int\limits_1^e {\ln ydy} $
= $e - \int\limits_0^1 {{e^x}dx} $
= $e - \left( {{e^x}} \right)_0^1$
= $e - \left( {e - 1} \right)$
= e – e + 1
= 1
Therefore, option (A) and (D) are the correct answer.
Note: Always remember that the first and the most important step is to plot the two curves on the same graph. If one can’t plot the exact curve, at least an idea of the relative orientations of the curves should be known.
Complete step-by-step answer:
As we know, the area under the curve y = f(x) between x = a & x = b, one must integrate y = f(x) between the limits of a and b.
In the above figure, Area bounded by $y = {e^x}$ and lines x=0 and y=e is represented as a shaded region of the graph.
From figure we conclude that-
In the graph, the upper curve will be y = e and the lower one will be $y = {e^x}$.
Required area is,
A = $\int\limits_1^e {\ln ydy} $
= $e - \int\limits_0^1 {{e^x}dx} $
= $e - \left( {{e^x}} \right)_0^1$
= $e - \left( {e - 1} \right)$
= e – e + 1
= 1
Therefore, option (A) and (D) are the correct answer.
Note: Always remember that the first and the most important step is to plot the two curves on the same graph. If one can’t plot the exact curve, at least an idea of the relative orientations of the curves should be known.
Recently Updated Pages
Master Class 12 Business Studies: Engaging Questions & Answers for Success
Master Class 12 Chemistry: Engaging Questions & Answers for Success
Master Class 12 Biology: Engaging Questions & Answers for Success
Class 12 Question and Answer - Your Ultimate Solutions Guide
Master Class 11 Social Science: Engaging Questions & Answers for Success
Master Class 11 Chemistry: Engaging Questions & Answers for Success
Trending doubts
Which are the Top 10 Largest Countries of the World?
Draw a labelled sketch of the human eye class 12 physics CBSE
Name the crygenes that control cotton bollworm and class 12 biology CBSE
Differentiate between homogeneous and heterogeneous class 12 chemistry CBSE
Ribosomal RNA is actively synthesised in A Nucleoplasm class 12 biology CBSE
How many molecules of ATP and NADPH are required information class 12 biology CBSE