


How is a phase diagram for water different?
Answer
585.6k+ views
Hint: Phase diagram is a graphical representation of different phases of a substance with change in temperature and pressure. Pressure is plotted in Y-axis and temperature on X-axis.
Complete step by step answer:
In a phase diagram, each point represents a possible combination of temperature and pressure for a closed system. Here we need to talk about the phase diagram of water. Phase diagram of water is given below.
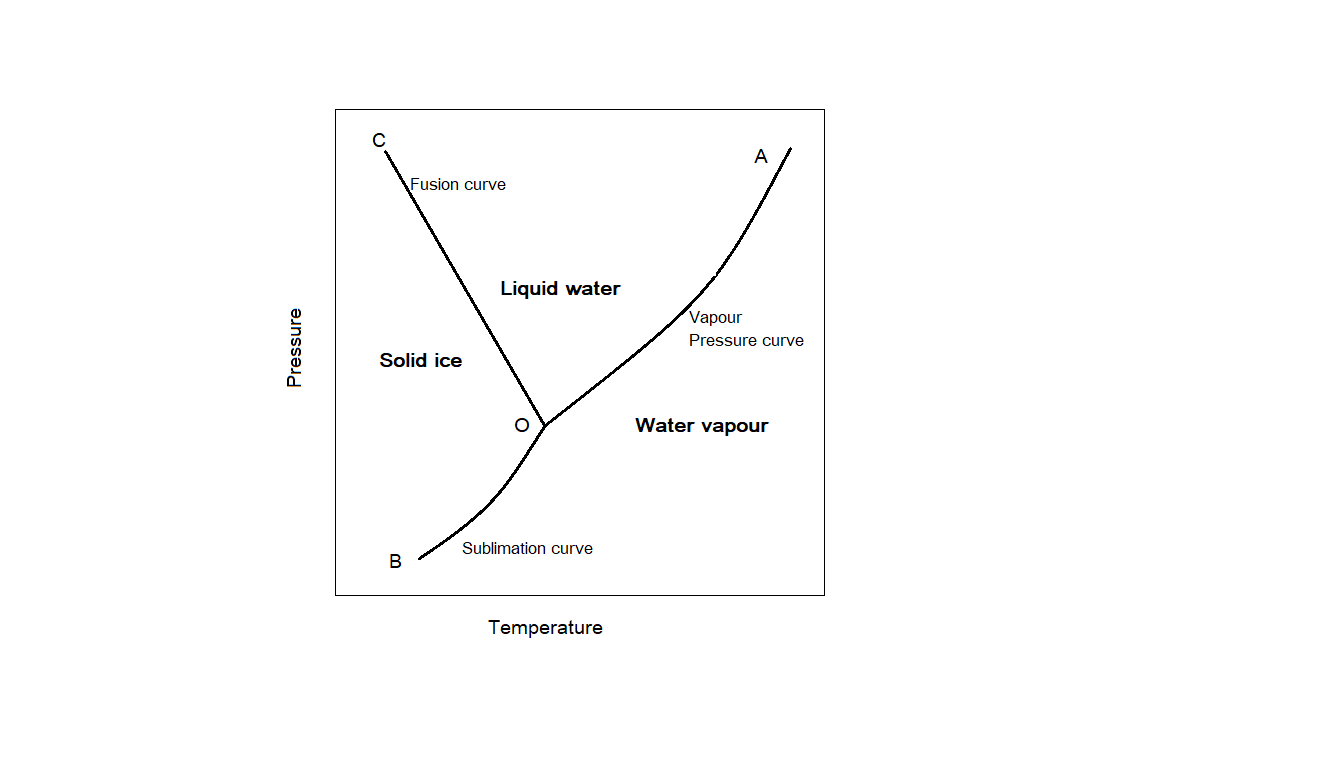
The area in the diagram represents only one phase- either solid, liquid or gas. The lines represent equilibrium between two phases and the point represents equilibrium between three phases.
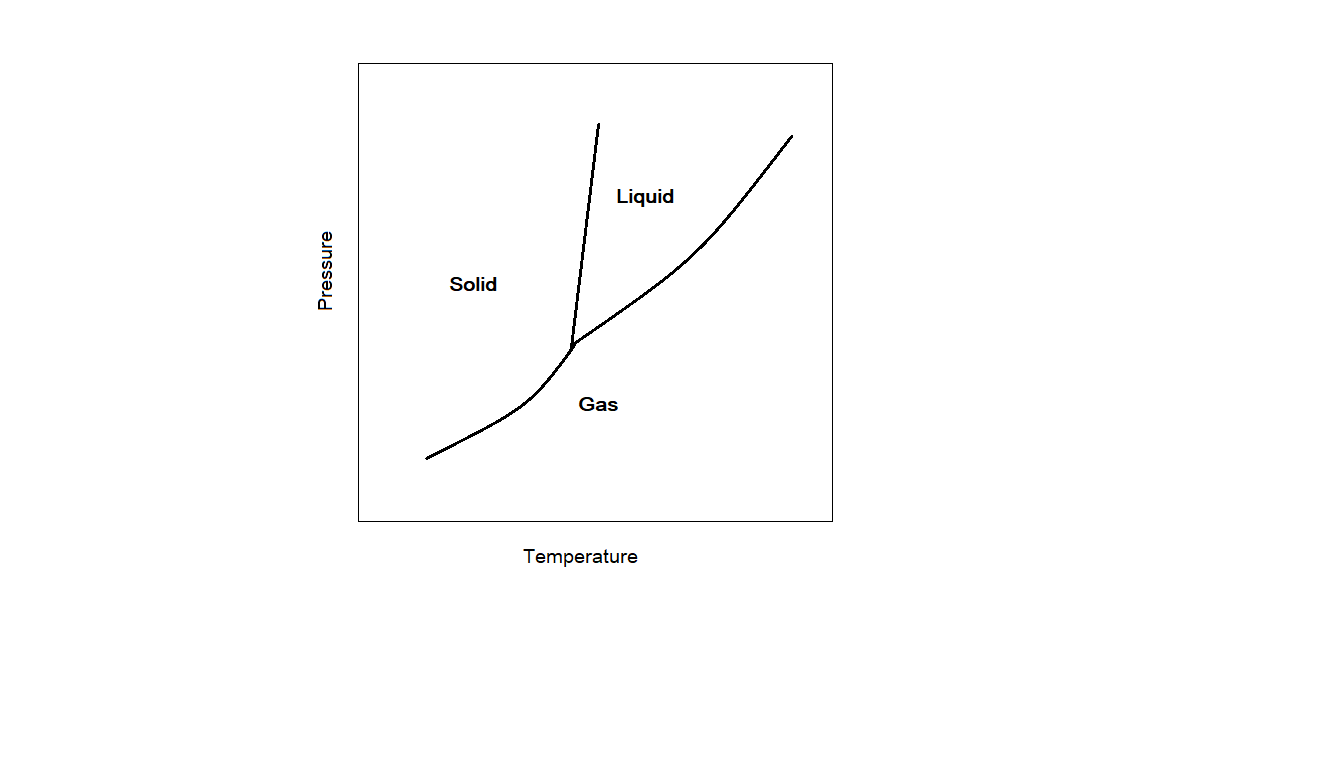
From the phase diagram of water, we can see that the line which represents the equilibrium between solid and liquid phase (OC) has a negative slope. For other substances like carbon dioxide and sulphur, the slope of the curve representing solid-liquid equilibrium is positive. This is how phase diagrams for water different from that of other substances. This is due to anomalous behaviour of water. The solid form, which we call ice is less dense than the liquid water. Usually solids have more density than liquids. But this is not the case with water. We can see the difference by comparing the phase diagram of water with that of $C{O_2}$ . The phase diagram of $C{O_2}$ is shown below.
Note: Ice can be easily melted by applying pressure. This is because on freezing, the density of water decreases by $9\% $ . In order to melt other solids, we need to apply heat. Because of the same reason, ice cubes float on the surface of water.
Complete step by step answer:
In a phase diagram, each point represents a possible combination of temperature and pressure for a closed system. Here we need to talk about the phase diagram of water. Phase diagram of water is given below.
The area in the diagram represents only one phase- either solid, liquid or gas. The lines represent equilibrium between two phases and the point represents equilibrium between three phases.
From the phase diagram of water, we can see that the line which represents the equilibrium between solid and liquid phase (OC) has a negative slope. For other substances like carbon dioxide and sulphur, the slope of the curve representing solid-liquid equilibrium is positive. This is how phase diagrams for water different from that of other substances. This is due to anomalous behaviour of water. The solid form, which we call ice is less dense than the liquid water. Usually solids have more density than liquids. But this is not the case with water. We can see the difference by comparing the phase diagram of water with that of $C{O_2}$ . The phase diagram of $C{O_2}$ is shown below.
Note: Ice can be easily melted by applying pressure. This is because on freezing, the density of water decreases by $9\% $ . In order to melt other solids, we need to apply heat. Because of the same reason, ice cubes float on the surface of water.
Recently Updated Pages
Master Class 12 Economics: Engaging Questions & Answers for Success
Master Class 12 English: Engaging Questions & Answers for Success
Master Class 12 Social Science: Engaging Questions & Answers for Success
Master Class 12 Maths: Engaging Questions & Answers for Success
Master Class 12 Physics: Engaging Questions & Answers for Success
Master Class 9 General Knowledge: Engaging Questions & Answers for Success
Trending doubts
One Metric ton is equal to kg A 10000 B 1000 C 100 class 11 physics CBSE
Difference Between Prokaryotic Cells and Eukaryotic Cells
Find the value of the expression given below sin 30circ class 11 maths CBSE
Two of the body parts which do not appear in MRI are class 11 biology CBSE
Draw a diagram of nephron and explain its structur class 11 biology CBSE
10 examples of friction in our daily life