


A distribution consisting of daily profits is given below. The profits are that which are earned by some shops, namely \[50\] within an area. Explain how one will convert this distribution into a cumulative frequency distribution of the ‘less than type’, and also construct its Ogive.
Daily Profit \[0 - 50\] \[50 - 100\] \[100 - 150\] \[150 - 200\] \[200 - 250\] \[250 - 300\] Number of shops \[6\] \[9\] \[13\] \[10\] \[8\] \[4\]
| Daily Profit | \[0 - 50\] | \[50 - 100\] | \[100 - 150\] | \[150 - 200\] | \[200 - 250\] | \[250 - 300\] |
| Number of shops | \[6\] | \[9\] | \[13\] | \[10\] | \[8\] | \[4\] |
Answer
530.1k+ views
Hint: We must remember what the cumulative frequency distribution of ‘less than type’ means; it means that every following frequency will be the sum of the previous and current class frequencies. And we should understand clearly from the words ‘less than type’ that each interval will be transformed into a format of ‘Less than _’ where the ‘_’ takes the upper limit of each given interval.
Complete step-by-step answer:
Let us look at the distribution given to us;
From that table we can see that we are given continuous class intervals with a constant range \[50\].
Now look at our aim, it is to make this distribution into a ‘less than type’ cumulative distribution table. We also have to draw an Ogive by observing the ‘less than type’ table.
To start off, let us think how we can convert a distribution into ‘less than type’; it is by considering the upper limits of each interval and every cumulative frequency will be made in such a way that it belongs to the ‘less than upper limit’ category.
To find cumulative frequencies we must keep the initial value as it is, then the following values must be a sum of frequencies of the current interval and the previous interval. Let us construct the table now;
Now that we have formed the table, let us see how to draw it’s ogive.
We can plot the curve on a graph where the x-axis will contain the class intervals and y-axis will contain the frequencies.
The plot will look like this:
Note: To put it in simple words, for any random variable an ogive plots the cumulative frequency distribution. It comes in two types : ‘less than ogive’ where we plot the less than cumulative with the upper limit as the abscissae and ‘greater than ogive’, where we plot the reverse. The main application of Ogives is to be used for architectural purposes.
Complete step-by-step answer:
Let us look at the distribution given to us;
From that table we can see that we are given continuous class intervals with a constant range \[50\].
Now look at our aim, it is to make this distribution into a ‘less than type’ cumulative distribution table. We also have to draw an Ogive by observing the ‘less than type’ table.
To start off, let us think how we can convert a distribution into ‘less than type’; it is by considering the upper limits of each interval and every cumulative frequency will be made in such a way that it belongs to the ‘less than upper limit’ category.
To find cumulative frequencies we must keep the initial value as it is, then the following values must be a sum of frequencies of the current interval and the previous interval. Let us construct the table now;
| In Rs. the daily income | Number of shops (cumulative value) |
| Less than $50$ | $6$ |
| Less than $100$ | $15$ |
| Less than $150$ | $28$ |
| Less than $200$ | $38$ |
| Less than $250$ | $46$ |
| Less than $300$ | $50$ |
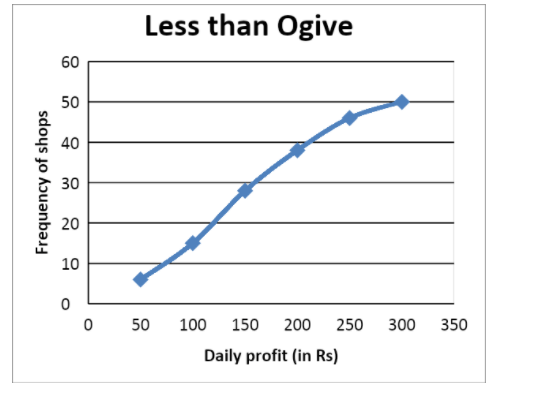
Now that we have formed the table, let us see how to draw it’s ogive.
We can plot the curve on a graph where the x-axis will contain the class intervals and y-axis will contain the frequencies.
The plot will look like this:
Note: To put it in simple words, for any random variable an ogive plots the cumulative frequency distribution. It comes in two types : ‘less than ogive’ where we plot the less than cumulative with the upper limit as the abscissae and ‘greater than ogive’, where we plot the reverse. The main application of Ogives is to be used for architectural purposes.

Recently Updated Pages
Basicity of sulphurous acid and sulphuric acid are
Master Class 9 Social Science: Engaging Questions & Answers for Success
Master Class 9 Science: Engaging Questions & Answers for Success
Master Class 9 Maths: Engaging Questions & Answers for Success
Master Class 9 General Knowledge: Engaging Questions & Answers for Success
Class 9 Question and Answer - Your Ultimate Solutions Guide
Trending doubts
Distinguish between Conventional and nonconventional class 9 social science CBSE
Describe the 4 stages of the Unification of German class 9 social science CBSE
What is the role of Mahatma Gandhi in national movement
What was the Treaty of Constantinople of 1832 class 9 social science CBSE
What is a legitimate government class 9 social science CBSE
What is the Full Form of ISI and RAW