


A curve between magnetic moment and temperature of magnet is ?
Answer
543.6k+ views
Hint:Let us first get some idea about magnetic moment and Curie temperature. The magnetic moment is the magnetic power and orientation of a magnet or other magnetic field-producing object. The Curie temperature, also known as the Curie point, is the temperature at which some materials lose their permanent magnetic properties and are replaced by induced magnetism.
Complete answer:
Let us first see the curve then we will jump to the explanation.
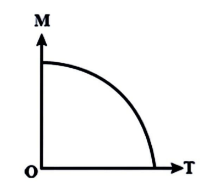
Here, $M$= Magnetic Moment and $T$= Curie temperature.
As seen in the diagram, the magnetic moment varies with temperature. Curie's temperature is the temperature at which a magnetic substance loses its magnetism. As a result, the temperature of Curie is found at the point where the curve intersects the $T$ axis.
The magnetic moment is a property that describes how strong a magnet can pull on the electric field lines. The position of the magnetic moment can be determined using the right hand thumb law. The Curie temperature is the point at which the properties of magnetic materials change dramatically.
At zero temperature, magnetic moments in opposite directions have zero net magnetic moment. When the temperature of a substance rises, the particles or atoms begin to vibrate more. The magnetism increases as the temperature rises. If the vibrations continue to rise, the temperature will drop to zero. Just above the Curie temperature does this happen. The graph is a rising curve before the Curie temperature. The graph begins to decrease as soon as the Curie temperature is obtained.
Note:So from the above discussion we can say that the magnetic moment is a vector quantity that measures an object's proclivity to interact with a magnetic field and the magnetism of a magnet decreases as temperature rises, and it is essentially zero above the Curie temperature graph.
Complete answer:
Let us first see the curve then we will jump to the explanation.
Here, $M$= Magnetic Moment and $T$= Curie temperature.
As seen in the diagram, the magnetic moment varies with temperature. Curie's temperature is the temperature at which a magnetic substance loses its magnetism. As a result, the temperature of Curie is found at the point where the curve intersects the $T$ axis.
The magnetic moment is a property that describes how strong a magnet can pull on the electric field lines. The position of the magnetic moment can be determined using the right hand thumb law. The Curie temperature is the point at which the properties of magnetic materials change dramatically.
At zero temperature, magnetic moments in opposite directions have zero net magnetic moment. When the temperature of a substance rises, the particles or atoms begin to vibrate more. The magnetism increases as the temperature rises. If the vibrations continue to rise, the temperature will drop to zero. Just above the Curie temperature does this happen. The graph is a rising curve before the Curie temperature. The graph begins to decrease as soon as the Curie temperature is obtained.
Note:So from the above discussion we can say that the magnetic moment is a vector quantity that measures an object's proclivity to interact with a magnetic field and the magnetism of a magnet decreases as temperature rises, and it is essentially zero above the Curie temperature graph.
Recently Updated Pages
Master Class 12 Business Studies: Engaging Questions & Answers for Success
Master Class 12 Biology: Engaging Questions & Answers for Success
Master Class 12 Chemistry: Engaging Questions & Answers for Success
Class 12 Question and Answer - Your Ultimate Solutions Guide
Master Class 11 Social Science: Engaging Questions & Answers for Success
Master Class 11 English: Engaging Questions & Answers for Success
Trending doubts
Which is more stable and why class 12 chemistry CBSE
Which are the Top 10 Largest Countries of the World?
Draw a labelled sketch of the human eye class 12 physics CBSE
Differentiate between homogeneous and heterogeneous class 12 chemistry CBSE
What are the major means of transport Explain each class 12 social science CBSE
Sulphuric acid is known as the king of acids State class 12 chemistry CBSE