


What Are the X Axis and Y Axis Definition Graph and Examples
The x-axis and y-axis are two important lines that make a graph. A graph consists of a horizontal axis and a vertical axis where data can be represented. There are two ways to describe a point, horizontally and vertically, which are easily understood using a graph. In a graph, the x-axis is horizontal and the y-axis is vertical. In this article, we will learn about the x-axis and y-axis and we will also see the graph plotter with points along with solving a few examples.
X-axis and Y-axis
Any point on the coordinate plane can be described by an ordered pair, which is written as (x-coordinate, y-coordinate) where the x-coordinate denotes a point on the x-axis and the y-coordinate denotes a point on the y-axis. The ordinate or "y-axis" is another name for the y-axis and another name for the x-axis is known as the "abscissa" or "x graph."
X-axis and Y-axis on the Graph
A graph is made up of two crucial lines called the x and y axes. In a graph, data can be represented on both the horizontal and vertical axes. A graph makes it simple to understand how a point might be defined vertically or horizontally. The x-axis and y-axis on the graph are these two horizontal and vertical lines or axes, respectively. As the origin is where the x- and y-axes intersect.

X-axis and Y-axis Graph
Any Point on the Y-axis Is of the Form
The fact that each point on the graph (straight line) of a linear equation involving two variables corresponds to a solution to the linear equation. As a result, each answer to the linear equation can be represented as a distinct point on the equation's graph. Lines parallel to the y-axis and the x-axis, respectively, represent the graphs of x = a and y = a.
The shape of any point on the y-axis is of the form (0, y).
The Ordinate of All Points on the X-axis
Any point on the x-axis has coordinates of (x,0), where x is the abscissa and 0 is the ordinate. As a result, each point on the x-axis has an ordinate of 0. Thus, the ordinate of all points on the x-axis is zero.
Graph Plotter with Points
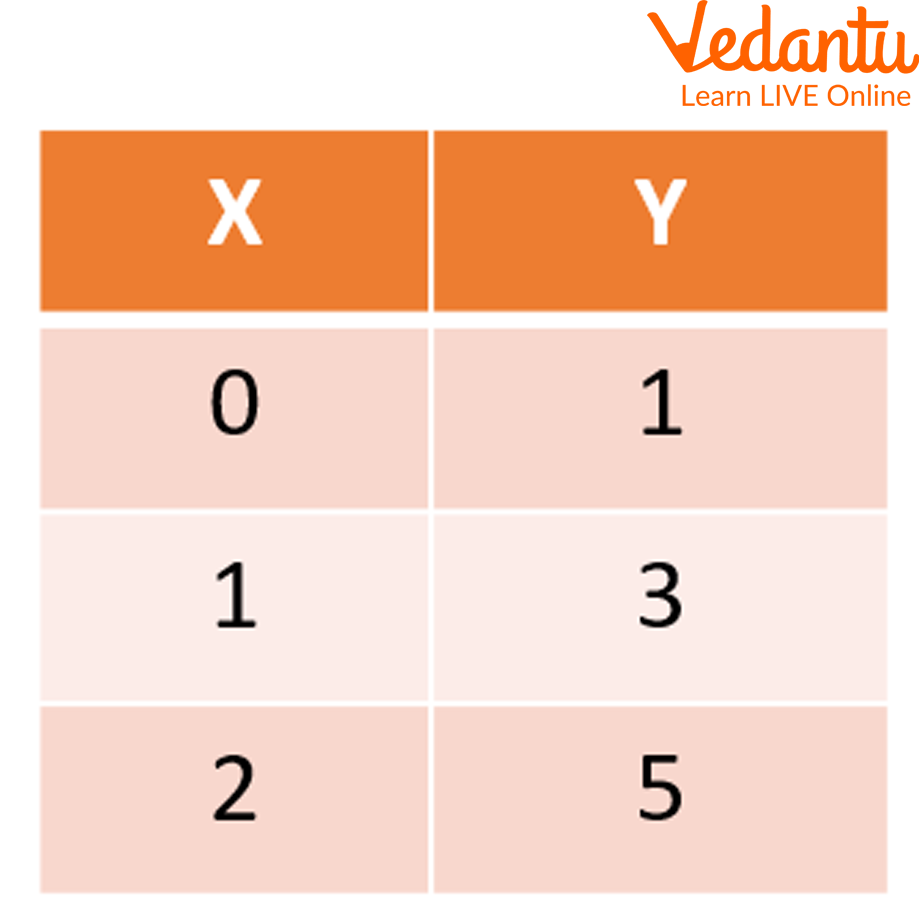
Take the linear equation y = 2x+1 as an example. Now, create a table with two columns for the values of x and y to graph this equation then draw a graph as follows:
Now by substituting the values in one of the variables we will complete the table.
So, if when x = 0
y = 2(0) + 1
=1
Similarly, when x = 1, y = 3 and when x = 2, y = 5.
Graph Plotter
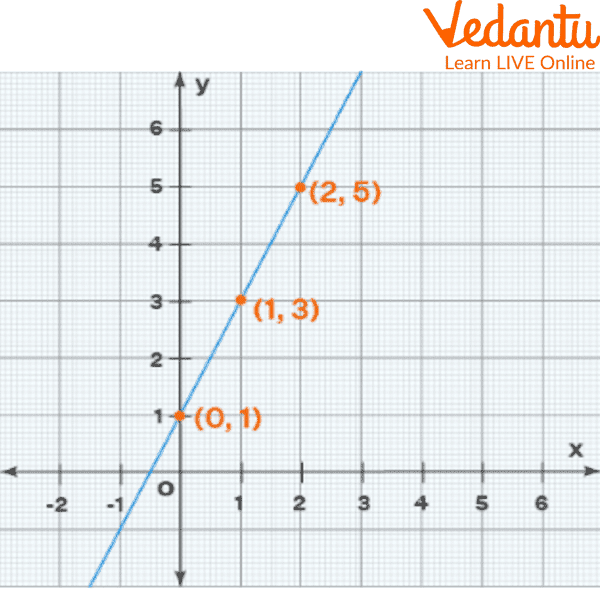
Now, we will plot the graph based on the above table.
So for locating the points on the graph, we just have to point to the x and y-axis.
So if x = 0 and y = 1. For this, the x-axis will be zero and on the y-axis, we have to go up to 1.
Therefore, the point will be (0,1). Similarly, other points can be drawn. In the end, join these points.
Graph Using Plotter Points
Solved Examples
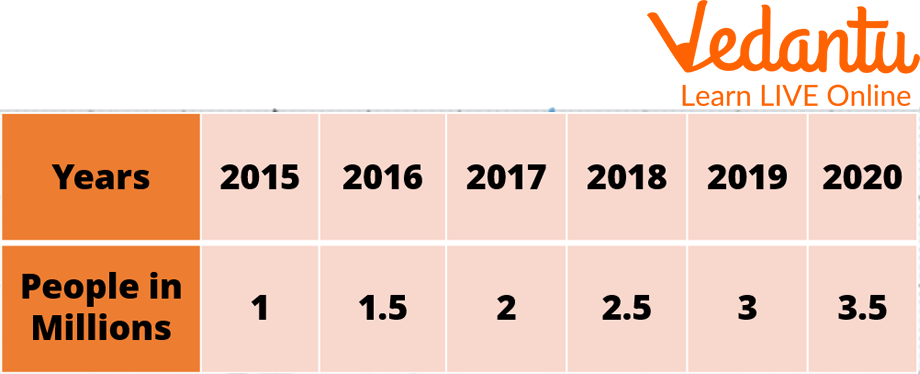
Q 1. The table for the X and Y graph shows the population of a city from 2015 to 2020 as:
Graph Plotter (Example 1)
Ans: The ordered pair is written as (x-coordinate, y-coordinate) or (x, y), where the x and y-coordinate implies a point on the x-axis or perpendicular distance from the y-axis whereas another one implies a point on the y-axis or perpendicular distance from the x-axis respectively. Each point is located on the graph indicated by an ordered pair with the x-axis coming first and the y-axis coming second. The chart is as follows:
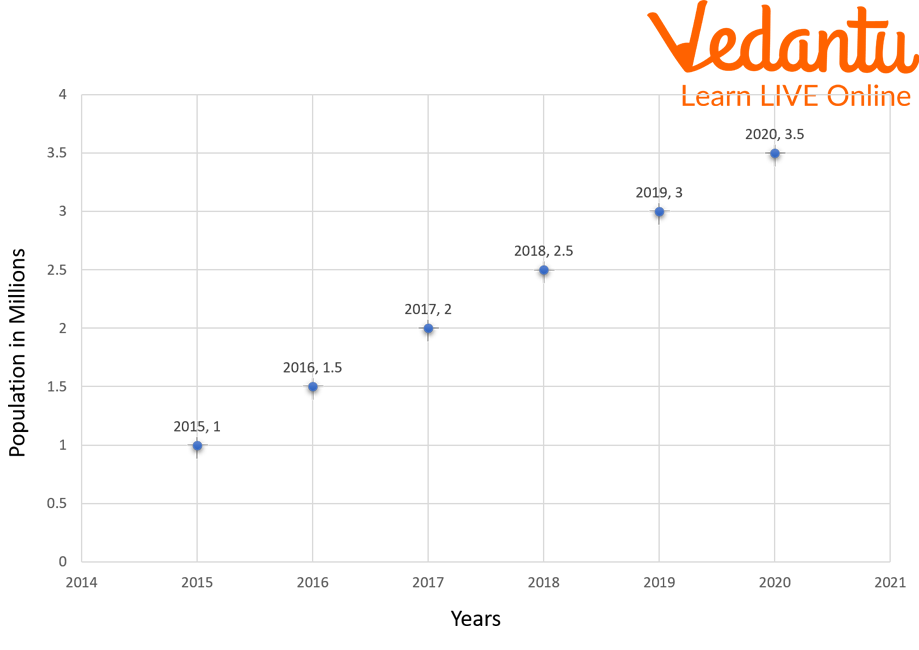
Graph (Example 1)
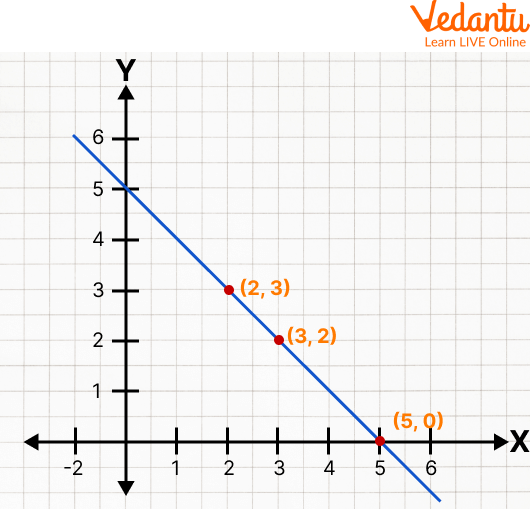
Q 2. Daniel's teacher assigns him a maths task with x and y axes that requires him to graph the points (3, 2) and (2, 3) and draw a line that connects them. Can you point to the location where it intersects the x-axis?
Ans: The graph can be used to plot the points as displayed.
Graph
Consequently, the line crosses the x-axis at that location (5, 0).
Practice Questions
Q 1. Draw a coordinate system and place the coordinates (1,2), (0,4), and (-1,-3) on it. Are all of the points on a line? Can you name the line?
Q 2. State true or false.
On the y-axis, the x coordinate is nonzero and the y coordinate is zero. Ans: False
The x-axis is a vertical line. Ans: False
On the x-axis, the x coordinate is nonzero and the y coordinate is zero. Ans: True
The y-axis is a vertical line. Ans: True
Summary
Any point on the coordinate plane is well defined by an ordered pair where the ordered pair is written as (x-coordinate, y-coordinate) or (x,y), where the x-coordinate represents a point on the x-axis or perpendicular distance from the y-axis and the y-coordinate represents a point on the y-axis or perpendicular distance from the x-axis. The point where the x-axis and y-axis intersect is known as the origin and is used as the reference point for the plane. The x-axis is also known as abscissa or x graph whereas the y-axis is also known as ordinate or y graph. Later, we have also seen how to plot the graph by using linear equations. In the end, we have included, solved examples, and practised problems to get a better understanding of the topic.
FAQs on X Axis and Y Axis on the Coordinate Plane
1. What is the X axis and Y axis in a graph?
The X axis is the horizontal line and the Y axis is the vertical line on a coordinate graph. Together, they form the Cartesian coordinate system used to locate points on a plane.
- The X axis represents horizontal movement (left or right).
- The Y axis represents vertical movement (up or down).
- The point where they intersect is called the origin (0, 0).
2. What is the origin in the coordinate plane?
The origin is the point where the X axis and Y axis intersect, and its coordinates are (0, 0). It is the reference point for measuring all other points on the graph.
- It has zero distance along both axes.
- It divides the plane into four quadrants.
- All coordinates are measured relative to this point.
3. How do you plot a point on the X and Y axis?
To plot a point, move along the X axis first, then move vertically along the Y axis according to the ordered pair (x, y).
- Step 1: Start at the origin (0,0).
- Step 2: Move right (positive) or left (negative) based on the x-value.
- Step 3: Move up (positive) or down (negative) based on the y-value.
4. What is the difference between the X axis and Y axis?
The main difference is that the X axis is horizontal while the Y axis is vertical in the coordinate plane.
- X axis measures horizontal position (x-coordinate).
- Y axis measures vertical position (y-coordinate).
- Points are written as (x, y), always in that order.
5. What are the four quadrants formed by the X and Y axes?
The X and Y axes divide the coordinate plane into four regions called quadrants. The signs of coordinates in each quadrant are:
- Quadrant I: (+, +)
- Quadrant II: (−, +)
- Quadrant III: (−, −)
- Quadrant IV: (+, −)
6. What is an ordered pair in the coordinate system?
An ordered pair is a pair of numbers written as (x, y) that represents the location of a point on the X and Y axes. The first number is the x-coordinate, and the second is the y-coordinate.
- (2, 5) means 2 units right and 5 units up.
- (−4, 3) means 4 units left and 3 units up.
7. What is the equation of the X axis and Y axis?
The equation of the X axis is y = 0, and the equation of the Y axis is x = 0. These equations represent all points lying on each axis.
- On the X axis, the y-coordinate is always zero.
- On the Y axis, the x-coordinate is always zero.
8. How do you find the coordinates of a point on a graph?
To find coordinates, read the horizontal value first (x-value) and then the vertical value (y-value).
- Step 1: Drop a vertical line to the X axis to find the x-coordinate.
- Step 2: Move horizontally to the Y axis to find the y-coordinate.
- Step 3: Write the point as (x, y).
9. What is the role of X and Y axes in graphing linear equations?
The X and Y axes provide a reference system to graph linear equations like y = mx + c. They help determine intercepts and slope.
- The x-intercept occurs where y = 0.
- The y-intercept occurs where x = 0.
- The slope shows how steep the line is.
10. Why is the X axis horizontal and the Y axis vertical?
The X axis is horizontal and the Y axis is vertical by mathematical convention in the Cartesian coordinate system developed by René Descartes. This standard orientation ensures consistency in graphing worldwide.
- Horizontal movement represents changes in x-values.
- Vertical movement represents changes in y-values.
- This convention is used in algebra, geometry, and coordinate geometry.