


How To Find The Range Of Data With Formula And Examples
When we get a huge amount of data, we use different statistical terms to describe it. These include mean, mode, median, and range. Before calculating the range of data, it is crucial to understand these statistical terms.
So, let us discuss them more deeply.
Statistics
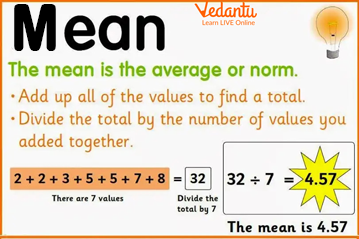
What is Mean?
Mean is nothing but the average of the numbers or the data given. The formula for getting mean is:
Sum of all the numbers in the data/ number of the numbers
For example: If there are five numbers from 1 to 5, their sum is 15, and the total numbers are 5. So, according to the formula, the mean is 15/5 equal to 3.
Mean
What is Mode?
Mode refers to the number that appears frequently or most of the time in a number series. If two numbers appear most frequently, there will be two modes. Hence, it will be called bimodal. If more than two numbers occur mostly, the data will be called multimodal. If all numbers appear with the same occurring frequency, then there will be no modes.
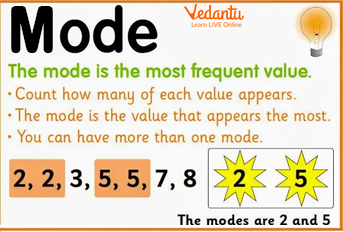
Mode
What is the Median?
Median is the middle number or a centrally occurring number in a data series. The first step to finding the median is to arrange data from lowest to highest or highest to lowest. If there are an odd number of data points, there will be one middle number as the median. Further, in the case of an even number of data points, there will be two middle numbers, and the median will be calculated by adding those numbers and dividing them by 2.
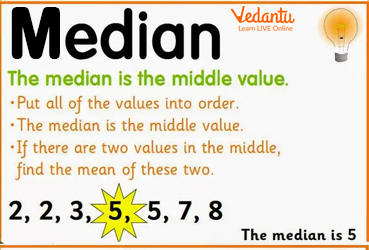
Median
What is the Range of Data?
In range statistics, the range is defined as the difference between the highest and lowest number in a data set. For example: if there is a data set given (2, 4, 6, 8, 12), the range will be 12 - 2 = 10. Therefore, the range could also be calculated by taking out the difference between the highest and lowest observation. The result is known as the range of the observation. It shows the spread of observation in statistics or data handling.

Range
What is the Range of Data Formula?
The formula to calculate the range of a set relies on the difference between the highest and the lowest values. Here are some of the range formulas.
Range = Highest value- lowest value.
Range = Highest observation- lowest observation.
Range = Maximum value- minimum value.
How to Find the Range of Data?
The first step to begin finding a range involves arranging the given data sets or numbers in ascending order. This means writing the lowest value first and moving on to the highest value at last. Then, use the formula to get the range of the data set.
Examples
Q1. Find the range of the given number series: 30, 25, 20, 35, 15, 40.
Ans: First arrange the numbers in ascending order. The new series will be; 15, 20, 25, 30, 35, and 40. Now, the highest value is 40, and the lowest value is 15. So, we can apply the formula, Range = Highest value - lowest value. Range = 40-15 = 25.
Q2. Find the range of the data series: 5, 9, 7, 11.
Ans: The new series is 5, 7, 9, and 11. The highest number is 11 and the lowest is 5. Hence, the range will be the highest number - lowest number or 11 - 5 = 6.
Q3. What is the range of the given series: 40, 45, 55, 50?
Ans: The new series is 40, 45, 50, and 55. The highest number is 55 and the lowest number is 40. The range is the highest number- lowest number= 15.
Practise Questions
Q1. What is the range of the series: 1, 3, 5, 7?
Ans: 6
Q2. Find the range of 2, 5, 8, and 11.
Ans: 9
Q3. What is the range of 20, 24, 28, and 32?
Ans: 12
Summary
In Mathematics, the mean is the average of the given numbers calculated by adding the numbers and dividing them by total numbers. Mode is the most frequent or repeating number in a data series. The median is the middle number in a given data set. All these terms are accompanied by 'range'. It is the difference between the maximum and minimum numbers or highest and lowest observations.
FAQs on Understanding The Range Of Data In Statistics
1. What is the range of data in maths?
The range of data is the difference between the highest value and the lowest value in a data set. It measures how spread out the data values are.
- Range = Highest value − Lowest value
- It is one of the simplest measures of spread (dispersion).
- A larger range means the data is more spread out.
2. How do you find the range of a data set?
To find the range of a data set, subtract the smallest value from the largest value. Follow these steps:
- Step 1: Arrange the data in ascending order (optional but helpful).
- Step 2: Identify the maximum value.
- Step 3: Identify the minimum value.
- Step 4: Use the formula Range = Maximum − Minimum.
3. What is the formula for the range?
The formula for range is Range = Maximum value − Minimum value. This formula applies to both grouped and ungrouped data.
- Maximum value = Highest observation in the data
- Minimum value = Lowest observation in the data
4. Can you give an example of calculating the range?
Yes, to calculate the range, subtract the smallest number from the largest number in the set. Example:
- Data set: 4, 8, 6, 3, 9
- Maximum value = 9
- Minimum value = 3
- Range = 9 − 3 = 6
5. What does the range tell you about data?
The range tells you how spread out the values in a data set are from the smallest to the largest value. It helps you understand data variability.
- A small range means values are close together.
- A large range means values are widely spread.
- It does not show how data is distributed between the extremes.
6. What is the range in grouped data?
In grouped data, the range is the difference between the upper limit of the highest class interval and the lower limit of the lowest class interval. The formula is:
- Range = Upper limit of highest class − Lower limit of lowest class
7. What is the difference between range and interquartile range?
The range measures the total spread from minimum to maximum, while the interquartile range (IQR) measures the spread of the middle 50% of the data. Key differences:
- Range = Maximum − Minimum
- IQR = Q3 − Q1
- Range is affected by outliers.
- IQR is less affected by extreme values.
8. Can the range be zero?
Yes, the range can be zero if all the values in the data set are the same. Since Range = Maximum − Minimum, if both are equal, the result is zero.
- Example: 5, 5, 5, 5
- Maximum = 5
- Minimum = 5
- Range = 5 − 5 = 0
9. Is the range affected by outliers?
Yes, the range is highly affected by outliers because it depends only on the minimum and maximum values. A single extreme value can greatly increase the range.
- Example without outlier: 2, 4, 6 → Range = 6 − 2 = 4
- Example with outlier: 2, 4, 50 → Range = 50 − 2 = 48
10. Why is the range important in statistics?
The range is important in statistics because it provides a quick measure of data spread and variability. It helps in:
- Comparing variability between two data sets
- Understanding overall dispersion
- Identifying possible outliers