


What Is Data Handling for Grade 2 and How to Read Tally Marks and Pictographs
In your school, you must have observed your teacher taking attendance of students in your class and every day recording it in the attendance register, or must have seen your teacher record your marks on report cards after every examination. Similarly, you must have seen different types of tables in your everyday life, consisting of names, numbers, figures, etc. These tables provide you with data.
Data is nothing but a collection of numbers gathered to provide you with some precise information. And, the process of collecting the set of data and organising or presenting it in a different form is known as data handling.
Data Handling Definition
Data handling is the process of gathering, recording, and presenting the data or information in a way that is meaningful to others.
Let's learn the different ways to represent raw data.
How to Represent Data Using Pictographs, Blocks, and Tally Marks
Here, we will learn to represent data using pictographs, tally marks, and bar graphs
Using Pictograph
A pictograph helps you to represent the given raw data through pictures of objects. This helps you to answer the questions based on the data at a glance.
Example:
Look at the pictograph below.
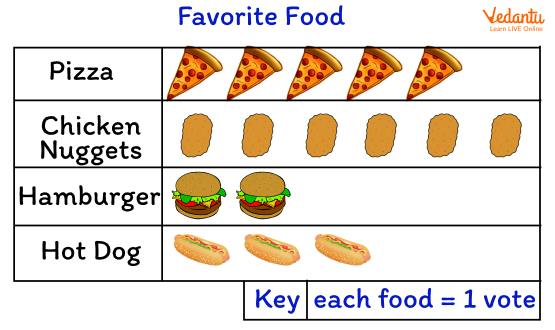
A pictograph
The above pictograph shows different kinds of fast food loved by children.
Using the pictogram above, you can easily answer the questions like:
How many children like hot dogs or pizza?
Which fast food is least or most preferred by children?
Using Bar Graphs
A bar graph, also known as a bar chart, is a graphical representation of data using bars of different heights.
Example
Suppose, you did a survey of your classmates to know which types of movies are most and least liked among them.
We can show this data on a bar like this:
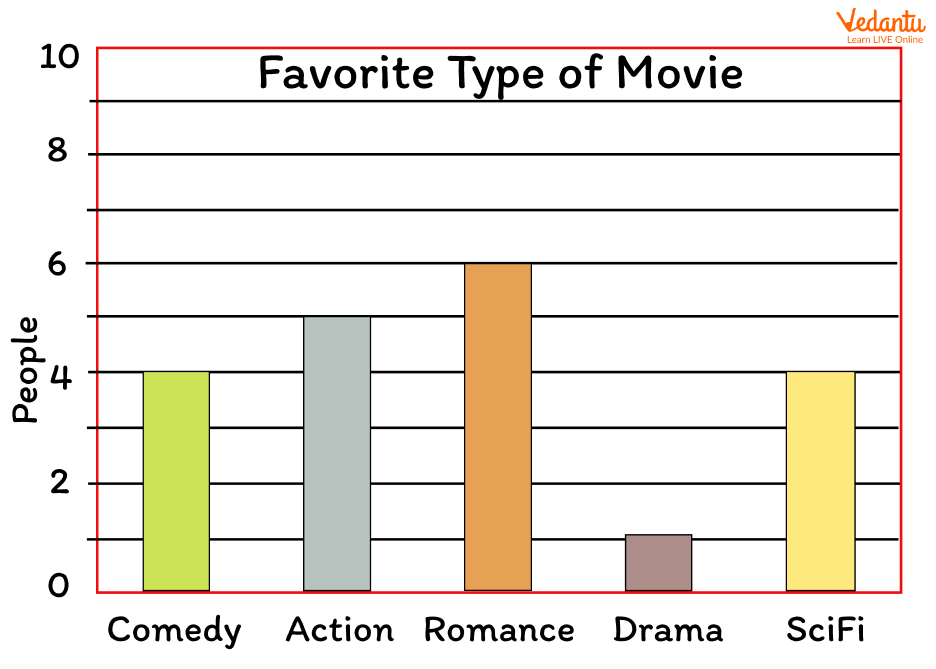
A bar graph
Looking at the bar graph above, you can now easily tell that:
The movies based on “Romance” are the most liked. (Bar with maximum height).
The movies based on “Drama” are the least liked. (Bar with minimum height).
Using Tally Marks
Data can also be represented using tally marks. Tally marks are easy to draw. You just have to mark it on a piece of paper.
Example
What is your favourite ice cream flavour?
Ask your friends what their favourite ice cream flavour is.
Put a tally mark next to the ice cream flavour they like and write the total in the next column.
Result: 4 friends liked vanilla, 5 friends liked butterscotch, 2 friends liked strawberry, and 3 friends liked pista flavour.
The most liked flavour is butterscotch and the least liked flavour is strawberry.
Conclusion
In short, data handling is the process of gathering, recording, and presenting the data or information in a way that is helpful for others to analyse, make predictions and choices, and draw conclusions. The different ways to represent data include pictographs, bar graphs, pie charts, tally marks, etc.
FAQs on Data Handling for Grade 2 Students with Fun Examples
1. What is data handling in Grade 2 Maths?
Data handling is the process of collecting, organizing, and understanding information in a simple way. In Grade 2 Maths, children learn how to:
- Collect data (like favorite fruits in the class)
- Organize data using tables or tally marks
- Show data using pictographs or bar graphs
- Answer questions based on the data
2. What is data in Maths for kids?
Data is a collection of facts or information gathered for a purpose. For example, the number of students who like apples, bananas, or grapes is data. In Grade 2 data handling, data can include numbers, objects, or choices collected from a group.
3. How do you collect data in Grade 2?
Data can be collected by asking questions and recording answers. Follow these simple steps:
- Choose a question (e.g., What is your favorite color?)
- Ask classmates
- Record each answer using tally marks or numbers
- Count the totals
4. What are tally marks in data handling?
Tally marks are quick counting marks used to record numbers. Each group of five tally marks is shown as:
- | | | | (four vertical lines)
- The fifth line crosses them diagonally
5. What is a pictograph in Grade 2 Maths?
A pictograph is a graph that uses pictures or symbols to show data. Each picture stands for a certain number. For example, if 1 star = 2 students and there are 3 stars, then the total number of students is 6. Pictographs make data easy and fun to understand.
6. How do you read a bar graph for Grade 2?
A bar graph is read by looking at the height or length of each bar. To read it:
- Check the title of the graph
- Look at the labels on each side
- See how tall each bar is
- Compare the bars
7. What is the difference between a pictograph and a bar graph?
The main difference is that a pictograph uses pictures while a bar graph uses bars to represent data. In a pictograph, each symbol stands for a number. In a bar graph, rectangular bars show numbers clearly. Both are used in Grade 2 data handling to compare information.
8. Why is data handling important for Grade 2 students?
Data handling is important because it helps children organize information and make comparisons. Students learn to:
- Understand numbers in real life
- Answer questions using data
- Develop logical thinking skills
- Improve problem-solving abilities
9. Can you give an example of a data handling problem for Grade 2?
A simple data handling problem asks students to collect and compare information. Example: 5 students like apples, 3 like bananas, and 2 like grapes.
- Total students = 5 + 3 + 2 = 10
- Most liked fruit = Apples
- Least liked fruit = Grapes
10. What are common mistakes in data handling for Grade 2?
Common mistakes in data handling include counting incorrectly or reading graphs wrongly. Students should remember to:
- Count tally marks carefully
- Check what each picture stands for in a pictograph
- Read labels before answering
- Compare numbers correctly