


Class 6 Maths NCERT Exemplar Solutions Chapter 5 Data Handling
1. Using tally marks, which one of the following represents the number five?
(A) ||||| (B) $\sqrt{}\sqrt{}\sqrt{}\sqrt{}\sqrt{}$ (C) $\cancel {|||}$ | (D) $\cancel {||||}$
Ans: Correct option - D
2. State whether the following statements are true or false:
(a) A tabular form of data is also a pictorial representation of the data.
Ans: False
(b) A pictograph represents data in the form of pictures of objects or parts of objects.
Ans: True
3. The blood groups of 25 students are recorded as under: A, B, O, A, AB, O, A, O, B, A, O, B, A, AB, AB, A, A, B, B, O, B, AB, O, A, B.
Arrange the information in a table using tally marks.
Ans:
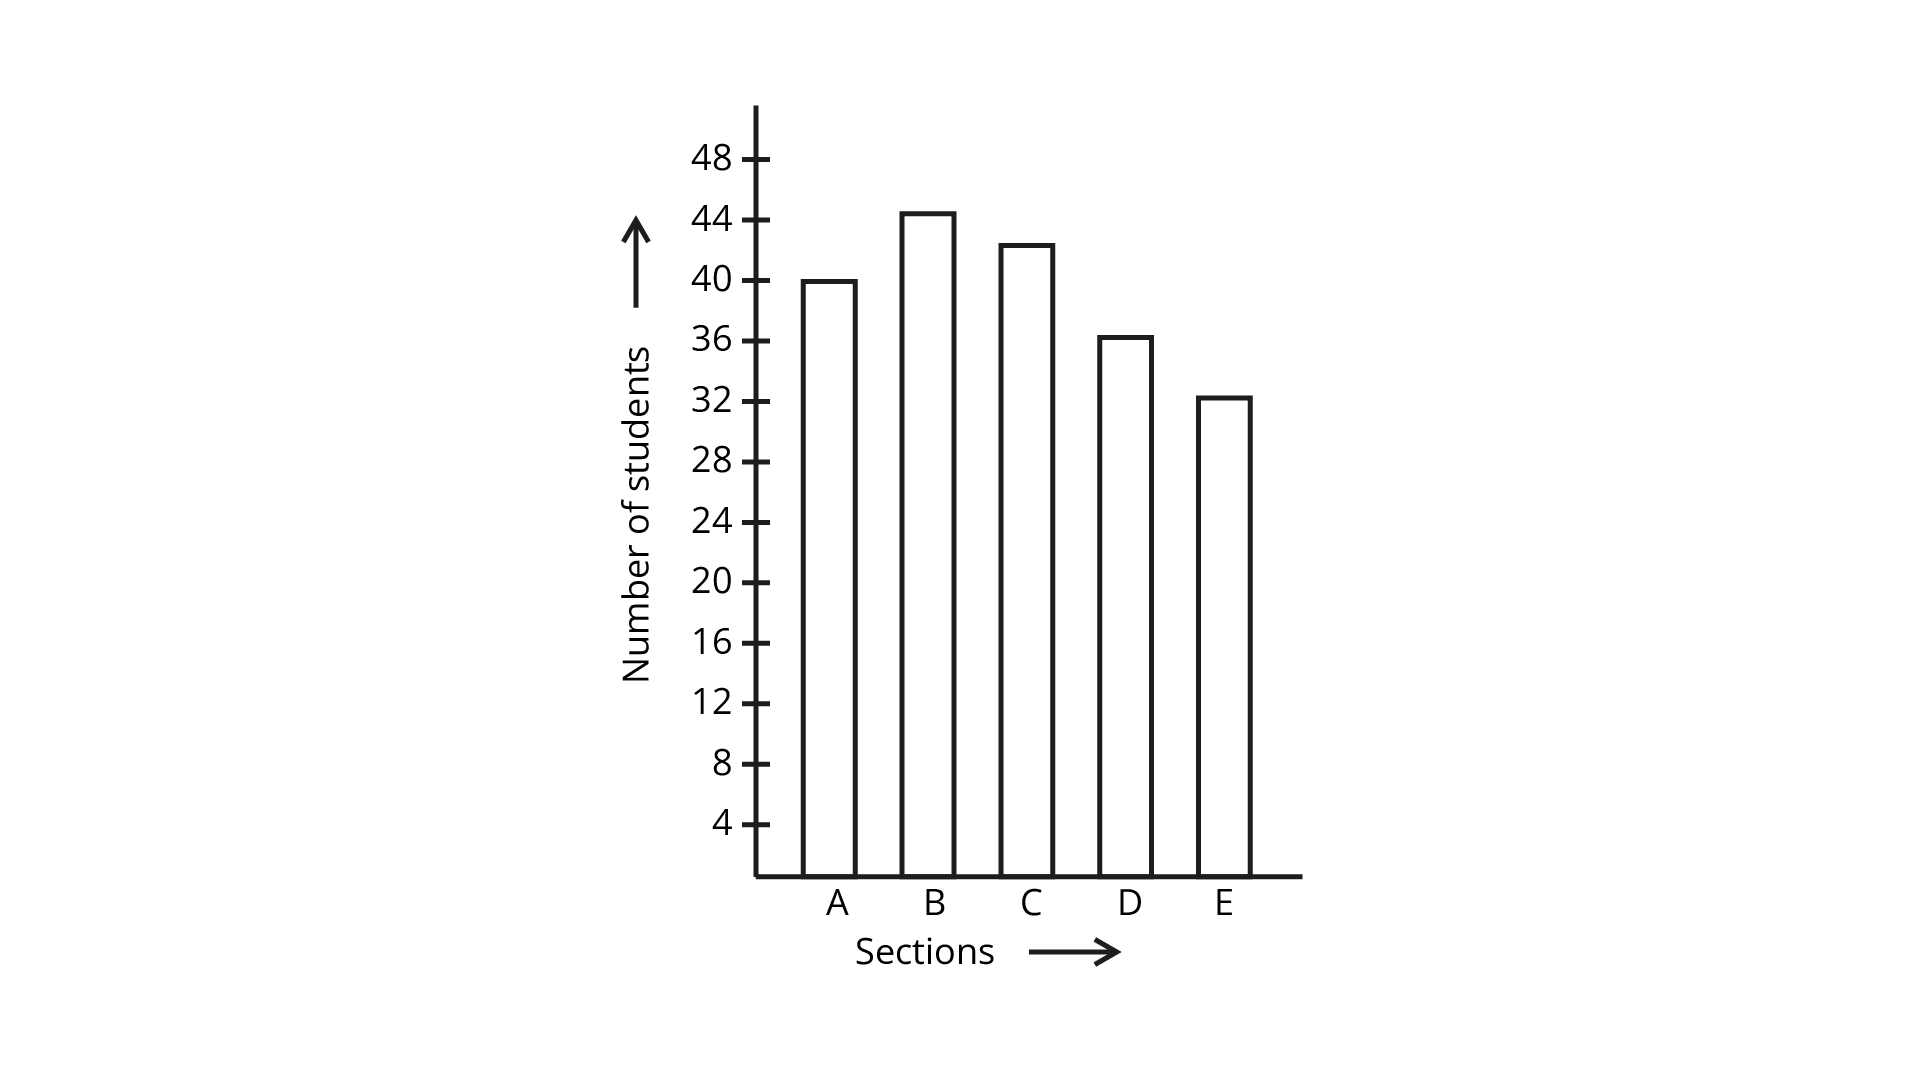
4. In a school, there are five sections of Class VI. The number of students in each section is given below:
Represent the above data using a bar graph.
Ans: To construct a bar graph we take the sections A, B, C, D and E on the horizontal axis and the number of students on vertical axis.
5. The number of visitors in a science exhibition on different days of a week is shown below: Look at the above pictograph and answer the following questions:
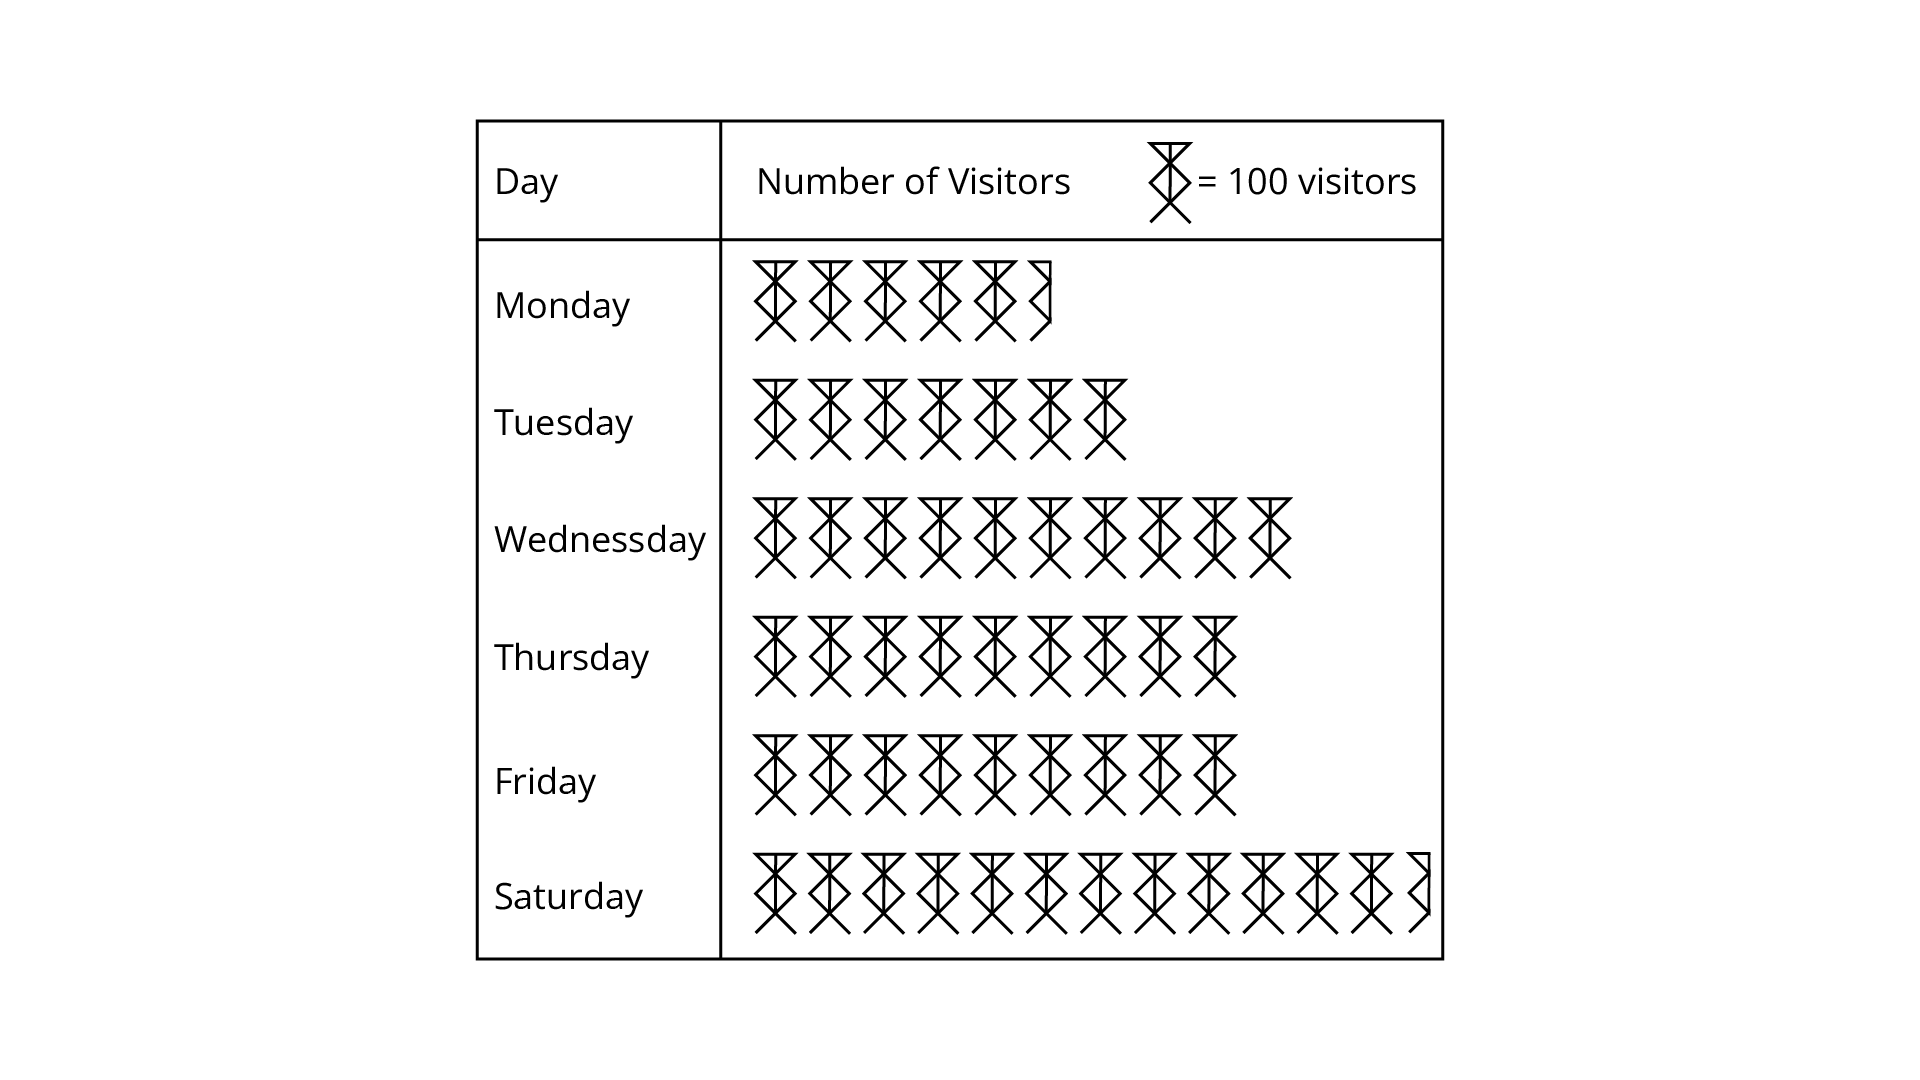
(a) What is the total number of visitors from Monday to Saturday?
Ans: The total number of visitors = 550 + 700 + 1000 + 900 + 900 + 1250 = 5300
(b) On which day was the number of visitors maximum?
What was their total number?
Ans: On Saturday the number of visitors was maximum and total number was 1250.
(c) On which day was the number of visitors minimum?
Ans: On Monday the number of visitors was minimum and total number was 550.
(d) On which day was the number of visitors same as the number of visitors on two days taken together?
Ans: On Saturday the number of visitors was equal to the number of visitors on Monday and Tuesday.
In questions 1 to 5, out of the four options, only one is correct. Write the correct answer.
1. Using tally marks, which one of the following represents the number eight:
(A)

(B) \[\cancel {|||}\] \[\cancel {|||}\]
(C) \[\cancel {|||||}\]$ ||
(D) \[\cancel {||||}\] |||
Ans: Correct option - D
Because we know 8=5+3
So, 8 is represented $\cancel{||||}$ ||| in tally marks .
2. The marks (out of 10) obtained by 28 students in a Mathematics test are listed as below:
8, 1, 2, 6, 5, 5, 5, 0, 1, 9, 7, 8, 0, 5, 8, 3, 0, 8, 10, 10, 3, 4,8, 7, 8, 9, 2, 0
The number of students who obtained marks more than or equal to 5 is
(A) 13
(B) 15
(C) 16
(D) 17
Ans: Correct option - D
Because the number of students who obtained marks more than or equal to 5 =17.
3. In question 2 above, the number of students who scored marks less than 4 is
(A) 15
(B) 13
(C) 12
(D) 10
Ans: Correct option - D
Because the number of students who obtained marks less than 4 = 10.
4. The choices of the fruits of 42 students in a class are as follows:
A,O,B,M,A,G,B, G,A, G,B,M,A,G, M, A, B, G, M, B,A,O,M,O,G,B,O, M, G, A,A, B,M,O,M,G, B, A, M, 0, M,0
Where A, B, G, M and O stand for the fruits Apple,Banana, Grapes, Mango and Orange respectively.
Which two fruits are liked by an equal number of students?
(A) A and M
(B) M and B
(C) B and O
(D) B and G
Ans: Correct option - D
Banana and Grapes two fruits are liked by an equal number of students and that is 8.
5. According to data of question 4, which fruit is liked by most of the students?
(A) O
(B) G
(C) M
(D) A
Ans: Correct option - C
Because mango is liked by most of the students.
In Questions 6 to 13, state whether the given statements are true (T) or false (F).
6. In a bar graph, the width of bars may be unequal.
Ans: False
In a bar graph, bars have equal and uniform width.
7. In a bar graph, bars of uniform width are drawn vertically only.
Ans: False
A bar of uniform width can be drawn vertically or horizontally both.
8. In a bar graph, the gap between two consecutive bars may not be the same.
Ans: False
In a bar graph, the gap or distance between two consecutive bars must be the same or equal.
9. In a bar graph, each bar (rectangle) represents only one value of the numerical data.
Ans: True
10. To represent the population of different towns using a bar graph, it is convenient to take one unit length to represent one person.
Ans: False
Because we take scale as per the given data only.
11. Pictographs and bar graphs represent numerical data.
Ans: True
12. An observation occurring five times in a data is recorded as |||||, using tally marks.
Ans: False
Because five represented as $\cancel{||||}$.
13. In a pictograph, if a symbol


Ans: True
In Questions 14 to 21, fill in the blanks to make the statements true
14. A….. is a collection of numbers gathered to give some meaningful information.
Ans: A data is a collection of numbers gathered to give some meaningful information.
15. The data can be arranged in a tabular form using……marks.
Ans: The data can be arranged in a tabular form using tally marks.
16.A……represents data through pictures of objects.
Ans: A pictograph represents data through pictures of objects.
17. In a bar graph,......can be drawn horizontally or vertically.
Ans: In a bar graph, bars can be drawn horizontally or vertically.
18. In a bar graph, bars of……. width can be drawn horizontally or vertically with…… spacing between them.
Ans: In a bar graph, bars of uniform width can be drawn horizontally or vertically with equal spacing between them.
19. An observation occurring seven times in a data is represented as……using tally marks.
Ans: An observation occurring seven times in a data is represented as $\cancel{||||}$ || using tally marks.
20. In a pictograph, if a symbol 🍁represents 20 basket then 🍁🍁🍁stands for ………flowers
Ans: In a pictograph, if a symbol represents 20 flowers in a basket then stands for 60 flowers.
21. On the scale of 1 unit length = 10 crore, the bar of length 6 units will represent ……. crore and of …….units will represent 75 crore.
Ans: On the scale of 1 unit length = 10 crore, the bar of length 6 units will represent 60 crore and of 7.5 units will represent 75 crore.
22. In an examination, the grades achieved by 30 students of a class are given below. Arrange these grades in a table using tally marks: B, C, C, E, A, C, B, B, D, D, D, D, B, C, C, C, A, C, B, E, A, D, C, B, E, C, B, E, C, D
Ans:
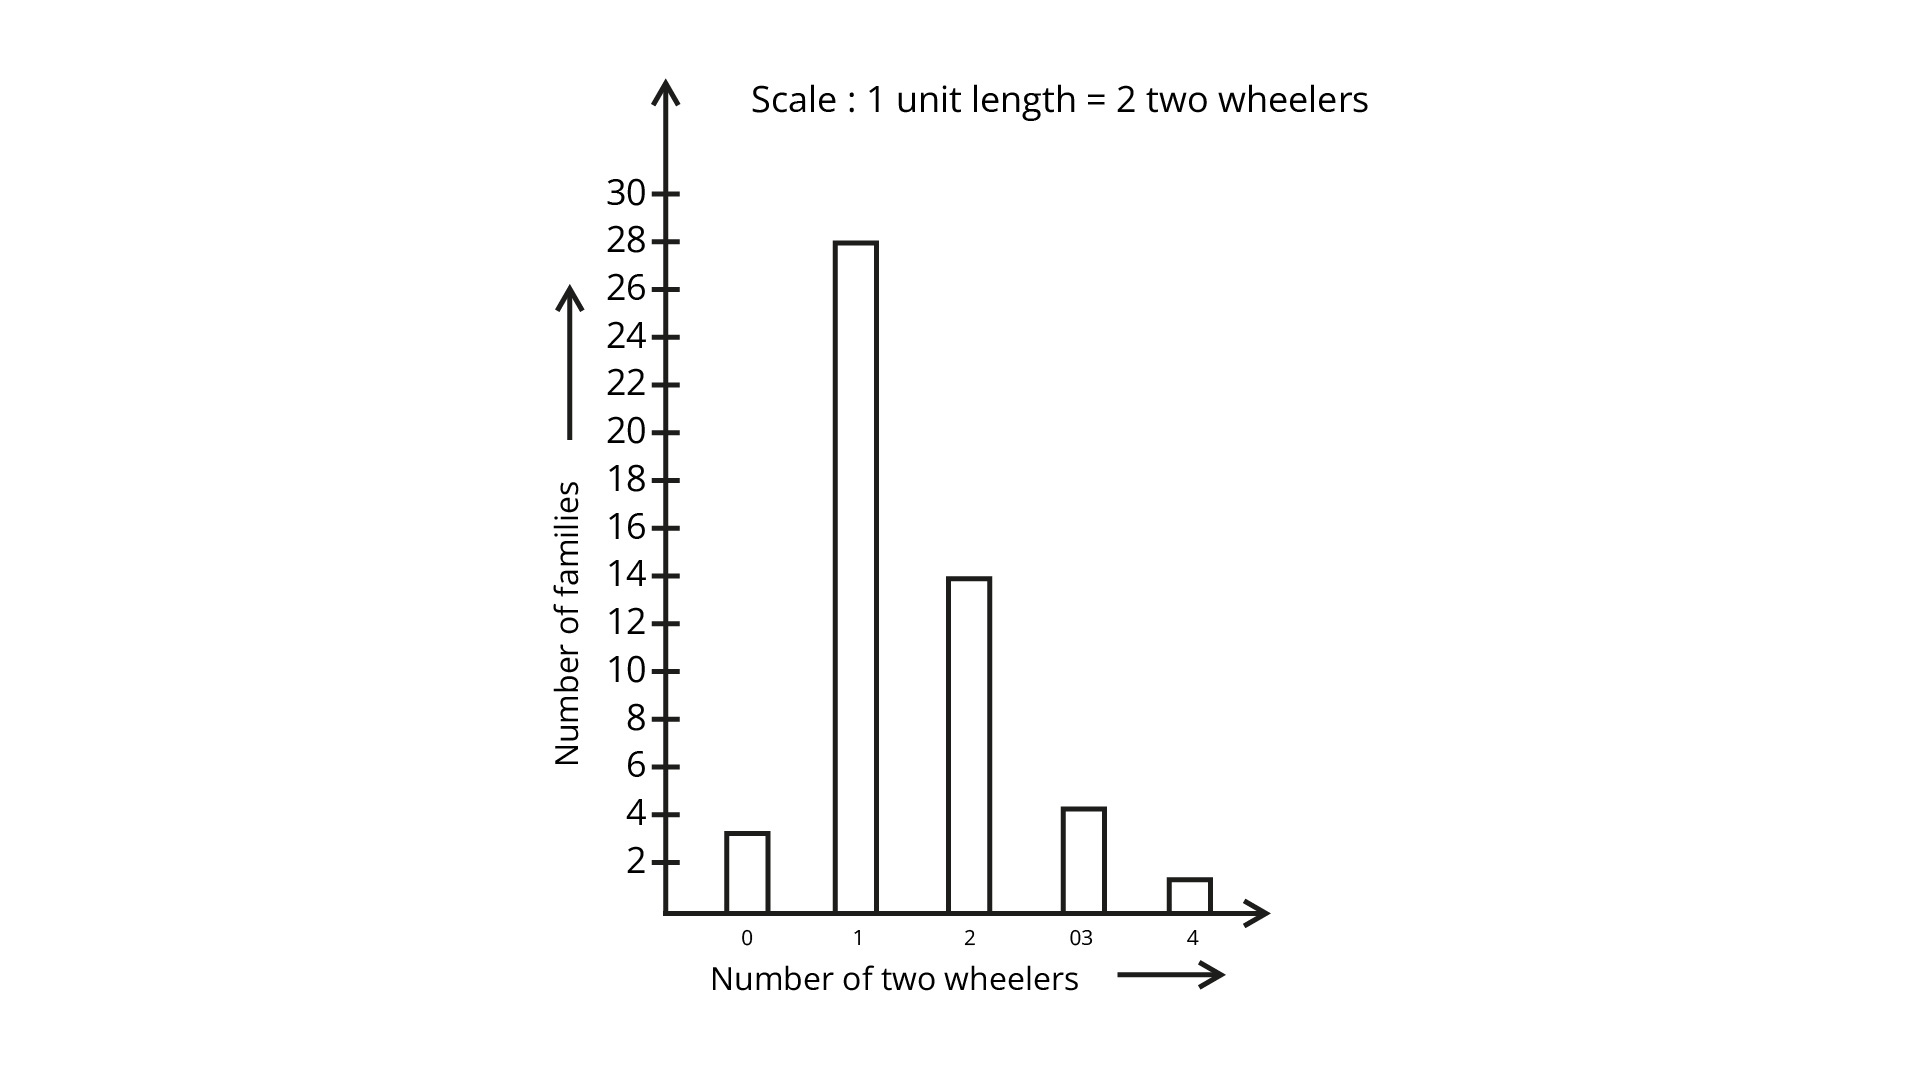
23. The number of two-wheelers owned individually by each of 50 families is listed below. Make a table using tally marks. 1, 1, 2, 1, 1, 1, 2, 1, 2, 1, 0, 1, 1, 2, 3, 1, 2, 1, 1, 2, 1, 2, 3, 1, 0, 2, 1, 0, 2, 1, 2, 1, 2, 1, 1, 4, 1, 3, 1, 1, 2, 1, 1, 1, 1,2, 3, 2, 1, 1
Find the number of families having two or more, two-wheelers
Solution:
24. The lengths in centimeters (to the nearest centimeter) of 30 carrots are given as follows:
15,22,21,20,22,15,15,20,20,15,20,18,20,22,21,20,21,18,21,20,18,21,18,22,20,15,21,18,20
Arrange the data given above in a table using tally marks and answer the following questions.
Ans:
What is the number of carrots which have length more than 20 cm?
Ans: Number of carrots having length more than 20 cm=6+4=10
Which length of the carrots occurs a maximum number of times? a minimum number of times?
Ans: From the table 20 cm length of the carrots occur a maximum number of times and length of the carrots occur a minimum number of times = 22 cm.
25. Thirty students were interviewed to find out what they want to be in the future. Their responses are listed below:
doctor, engineer, doctor, pilot, officer, doctor, engineer, doctor, pilot, officer, pilot, engineer, officer, pilot, doctor, engineer, pilot, officer, doctor, officer, doctor, pilot, engineer, doctor, pilot, officer, doctor, pilot, doctor, engineer
Arrange the data in a table using tally marks.
Ans:
26. Following are the choices of games of 40 students of
Class VI:
football, cricket, football, kho-kho, hockey, cricket, hockey, kho-kho, tennis, tennis, cricket, football, football, hockey, kho-kho, football, cricket, tennis, football, hockey,
kho-kho, football, cricket, cricket, football, hockey, kho-kho, tennis, football, hockey, cricket, football, hockey,cricket, football, kho-kho, football, cricket, hockey, football.
(a) Arrange the choices of games in a table using tally marks.
Ans:
(b) Which game is liked by most of the students?
Ans: From the above table the football game is liked by most of the students.
(c) Which game is liked by a minimum number of students?
Ans: From the above table tennis game is liked by a minimum number of students.
27. Fill in the blanks in the following table which represents the shirt size of 40 students of a school.
Ans:
28. Following pictograph represents some surnames of people listed in the telephone directory of a city
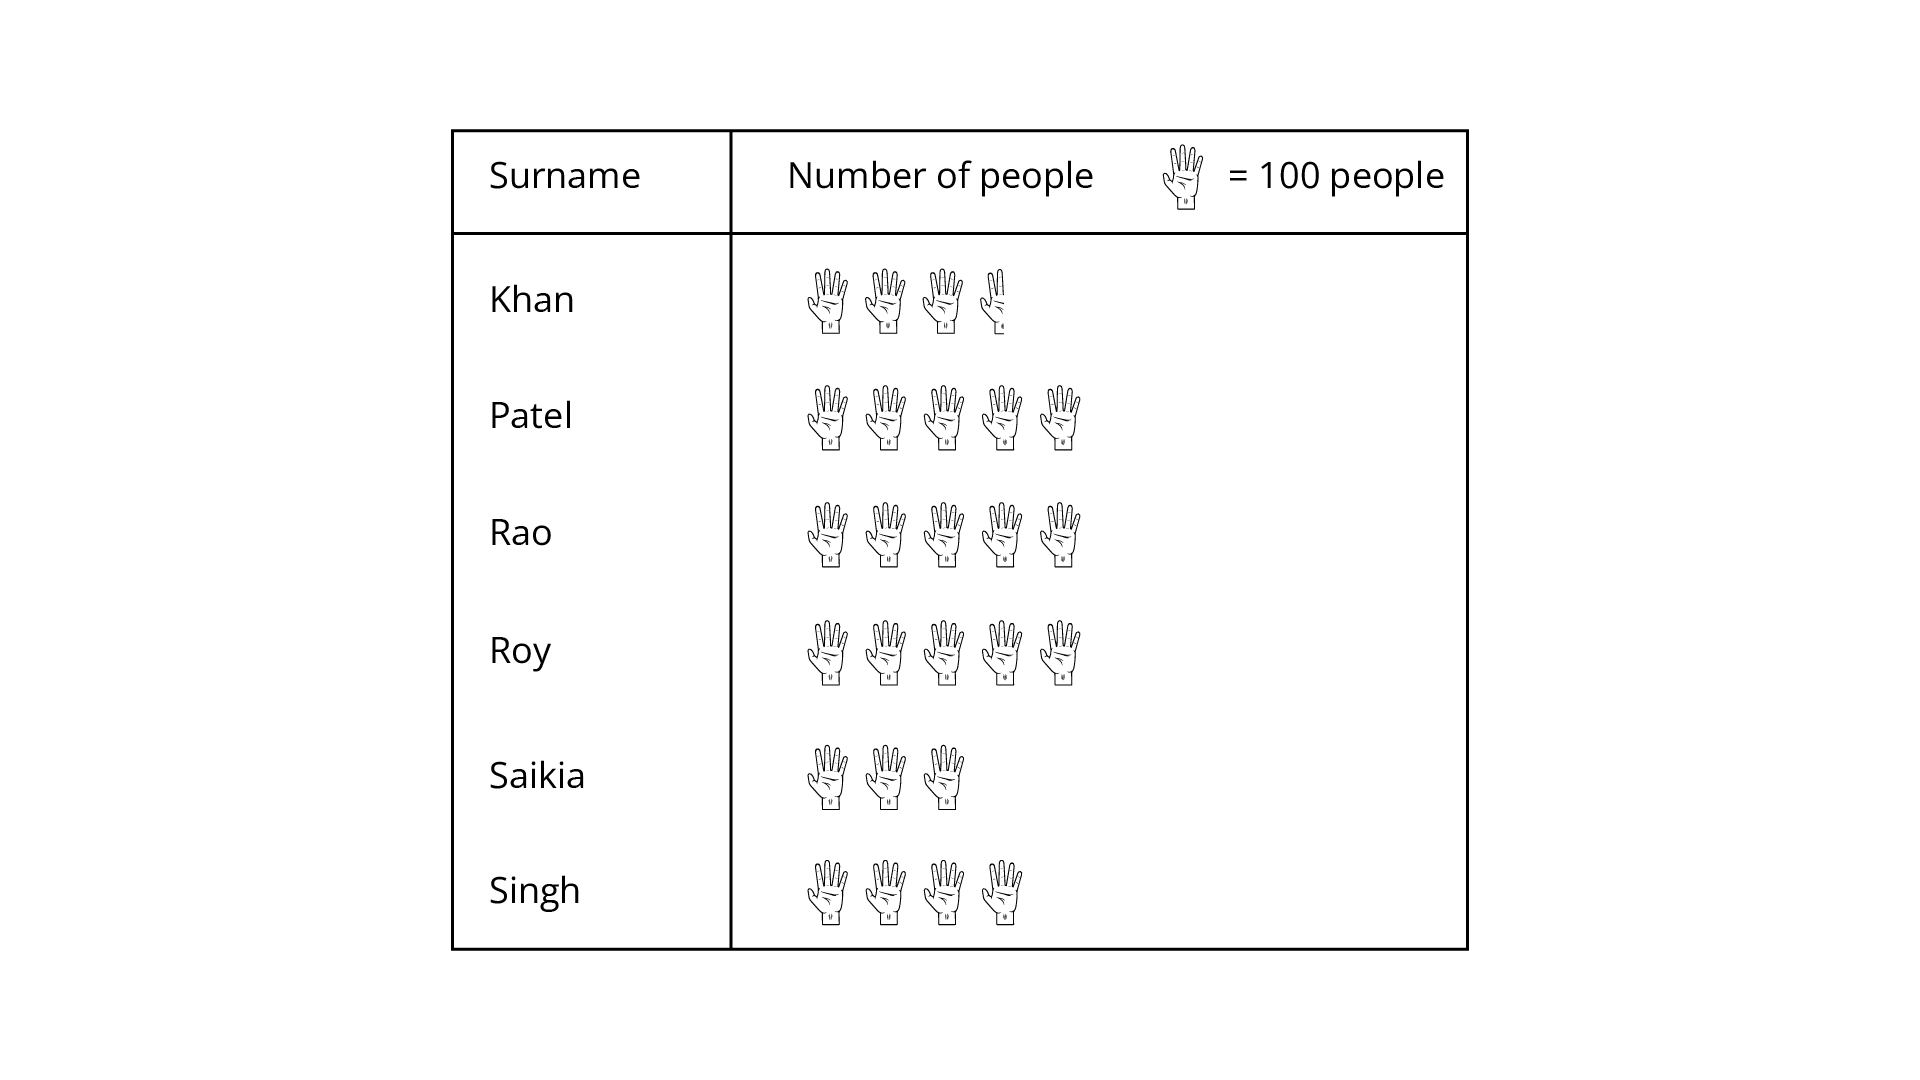
Observe the Pictograph and Answer the following Questions
(a) How many people have the surname "Roy"?
Ans: 4x100=400
So,400 people have the surname Roy.
(b) Which surname appears the maximum number of times in the telephone directory?
Ans: Surname ‘Patel’ appears the maximum number of times in the telephone directory.
(c) Which surname appears the least number of times in the directory?
Ans: Surname ‘Saikia’ appears the least number of times in the directory.
(d) Which two surnames appear an equal number of times?
Ans: Surname ‘Rao’ and 'Roy’ appear an equal number of times.
29. Students of Class VI in a school were given a task to count the number of articles made of different materials in the school. The information collected by them is represented as follows:
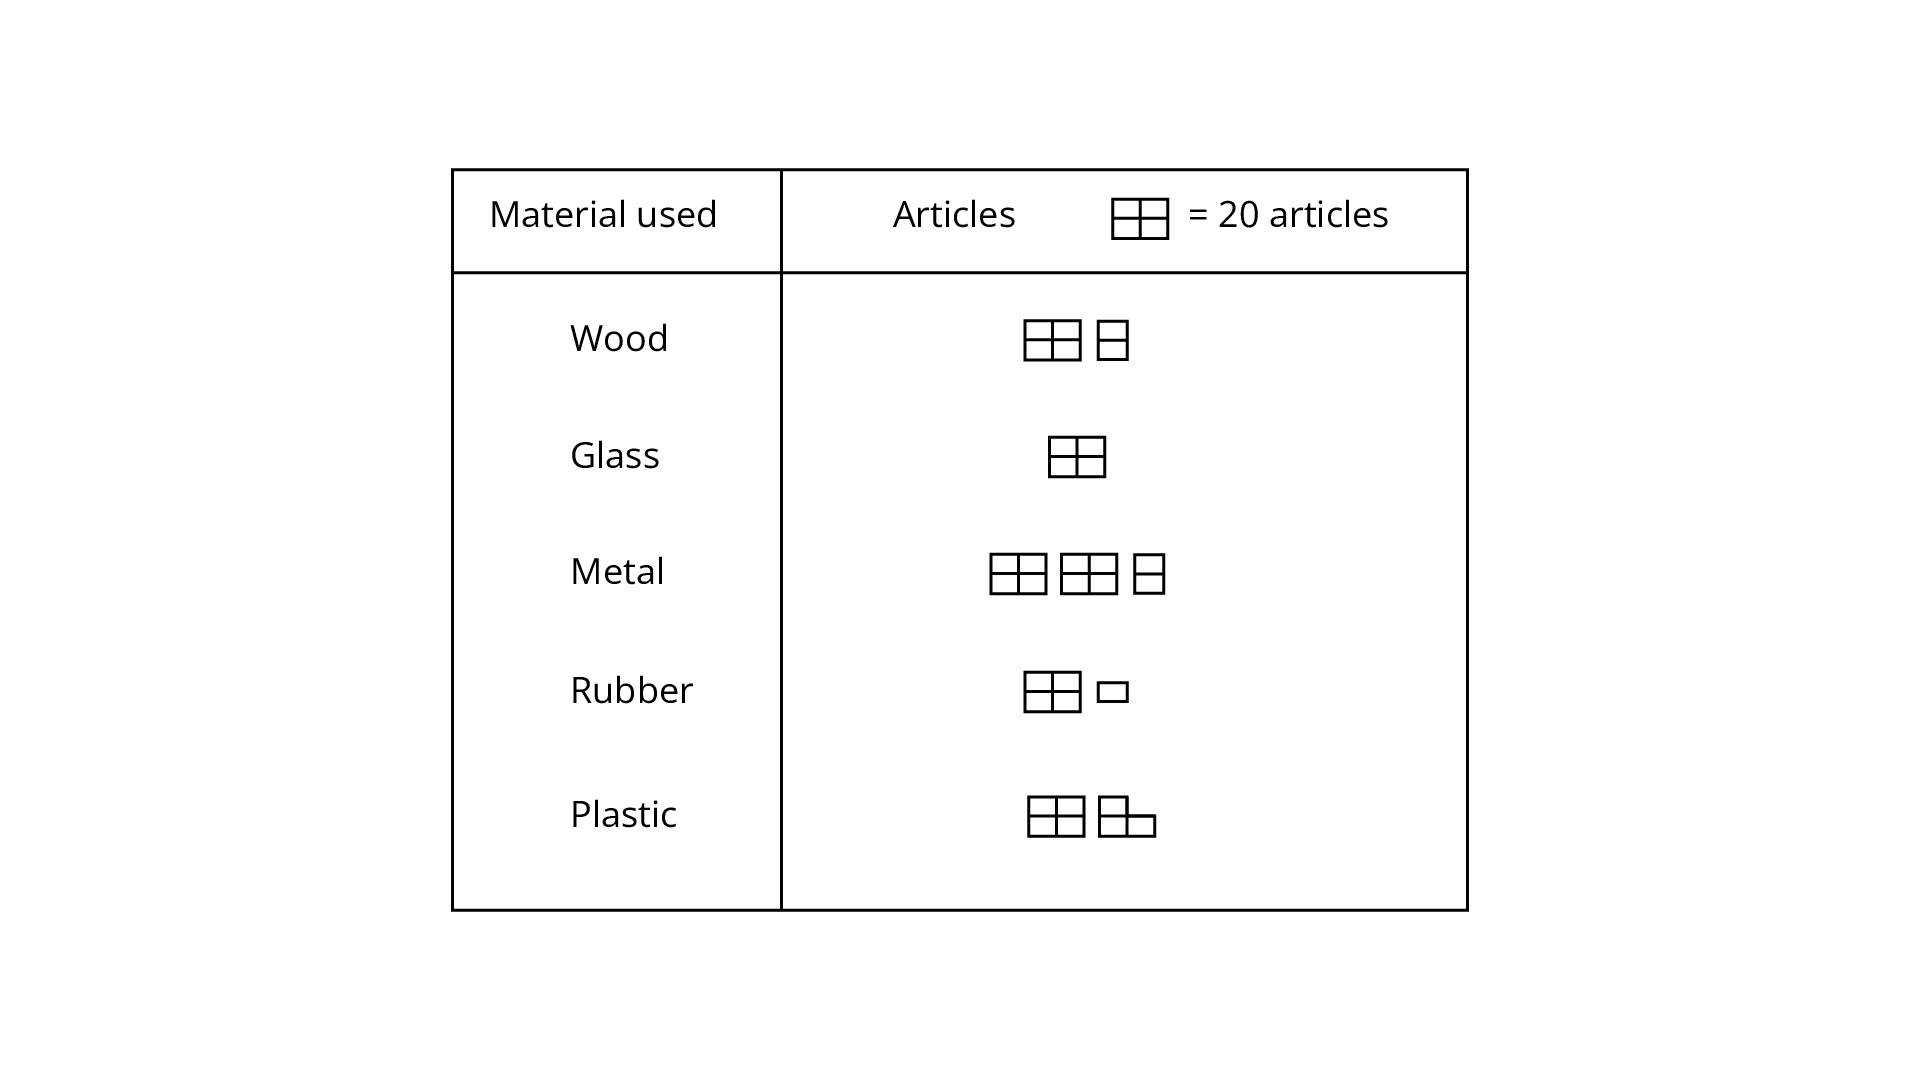
Observe the pictograph and answer the following questions:
Ans:
(a) Which material is used in a maximum number of articles?
Ans: Metal is used in the maximum number of articles.
(b) Which material is used in a minimum number of articles?
Ans: Glass is used in the minimum number of articles.
(c) Which material is used in exactly half the number of articles as those made up of metal?
Ans: Material rubber is used in exactly half the number of articles as those made up of metal.
(d) What is the total number of particles counted by the students?
Ans: Total number of articles = 160 that are counted by the students.
30. The number of scouts in a school is depicted by the following pictograph:
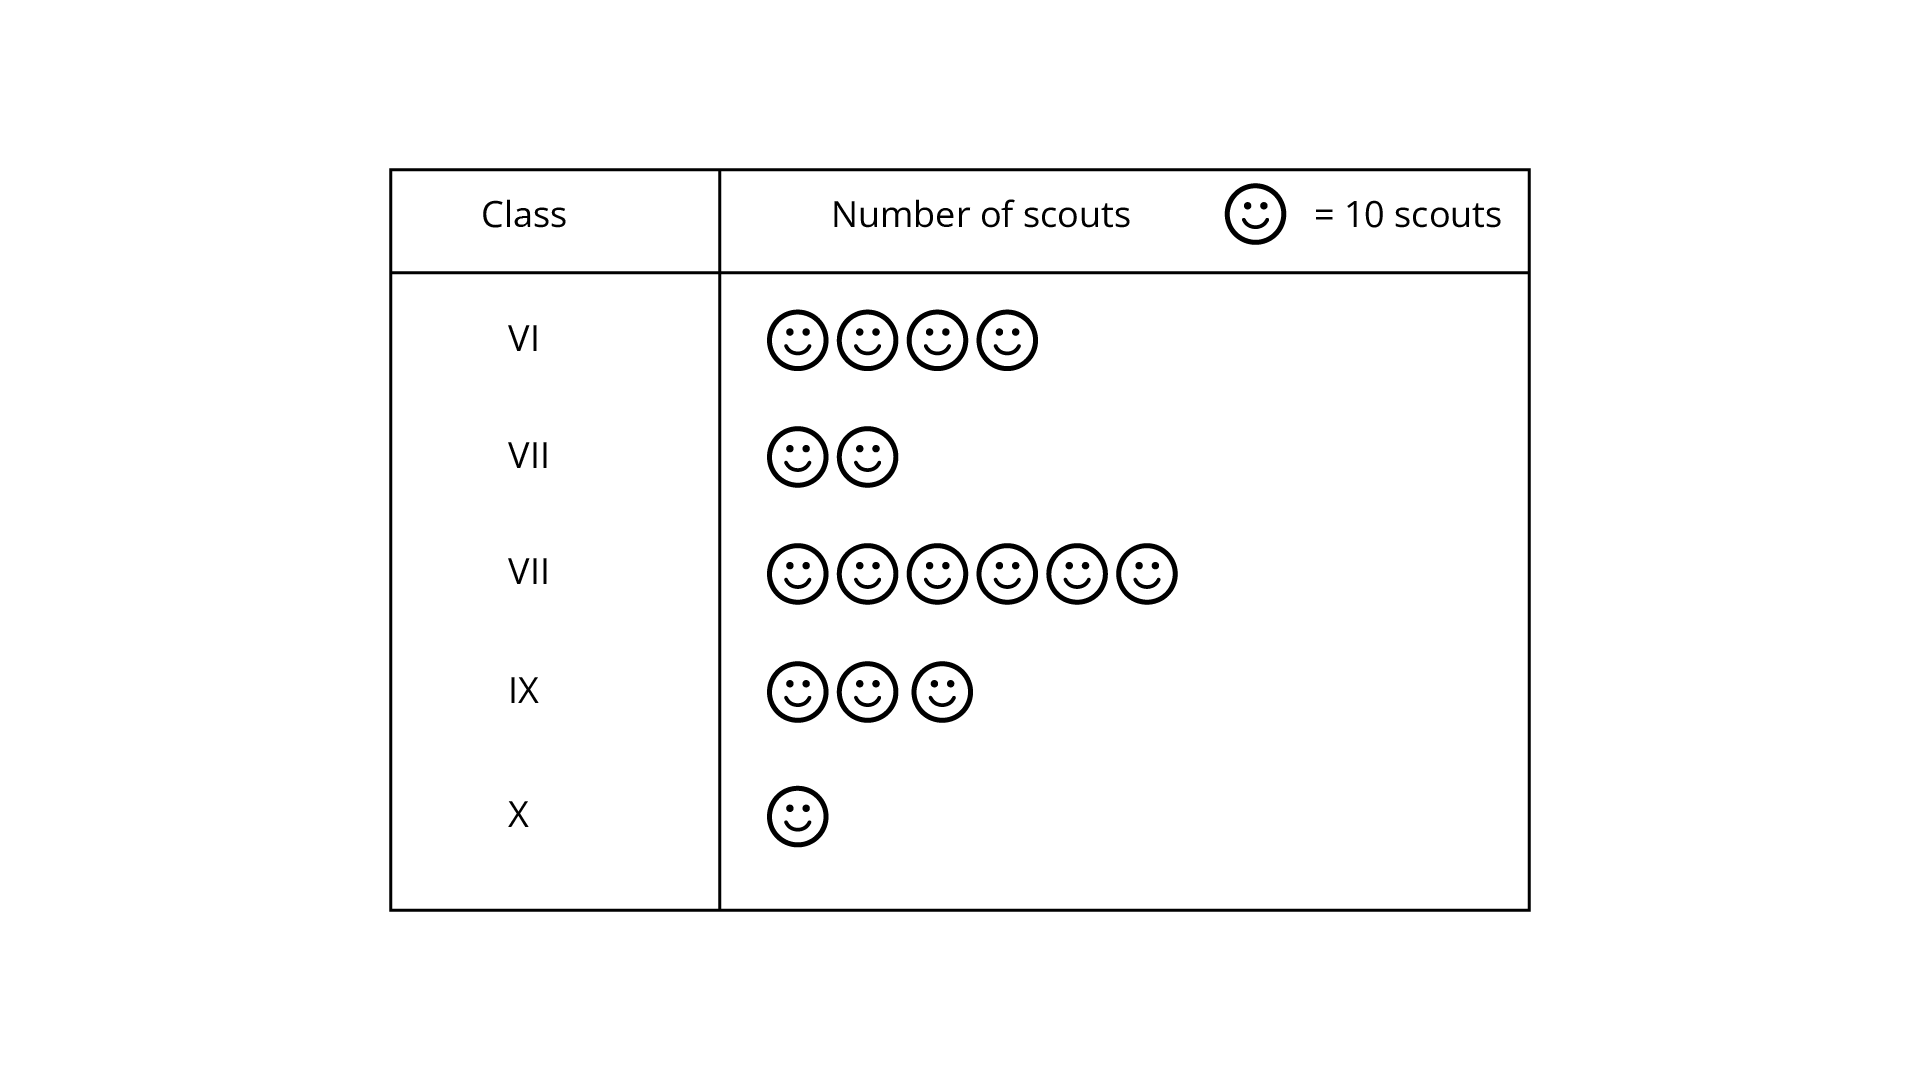
Observe the Pictograph and answer the following Questions
(a) Which class has the minimum number of scouts?
Ans: Class Ten (X) has the minimum number of scouts and that is 10.
(b) Which class has the maximum number of scouts?
Ans:Class Seven (VII) has the maximum number of scouts and that is 60.
(c) How many scouts are there in Class VI?
Ans:Number of scouts in Class four (VI) = 40.
(d) Which class has exactly four times the scouts as that of Class X?
Ans: From the table class Six (VI) has exactly four times the scouts as that of class Ten (X).
(e) What is the total number of scouts in the Classes VI to X ?
Ans: Number of scouts in the classes Four to Ten = 40+20+60+30+10=160.
31. A survey was carried out in a certain school to find out the popular school subjects among students of Classes VI to VIII. The data in this regard is displayed as pictograph given below:
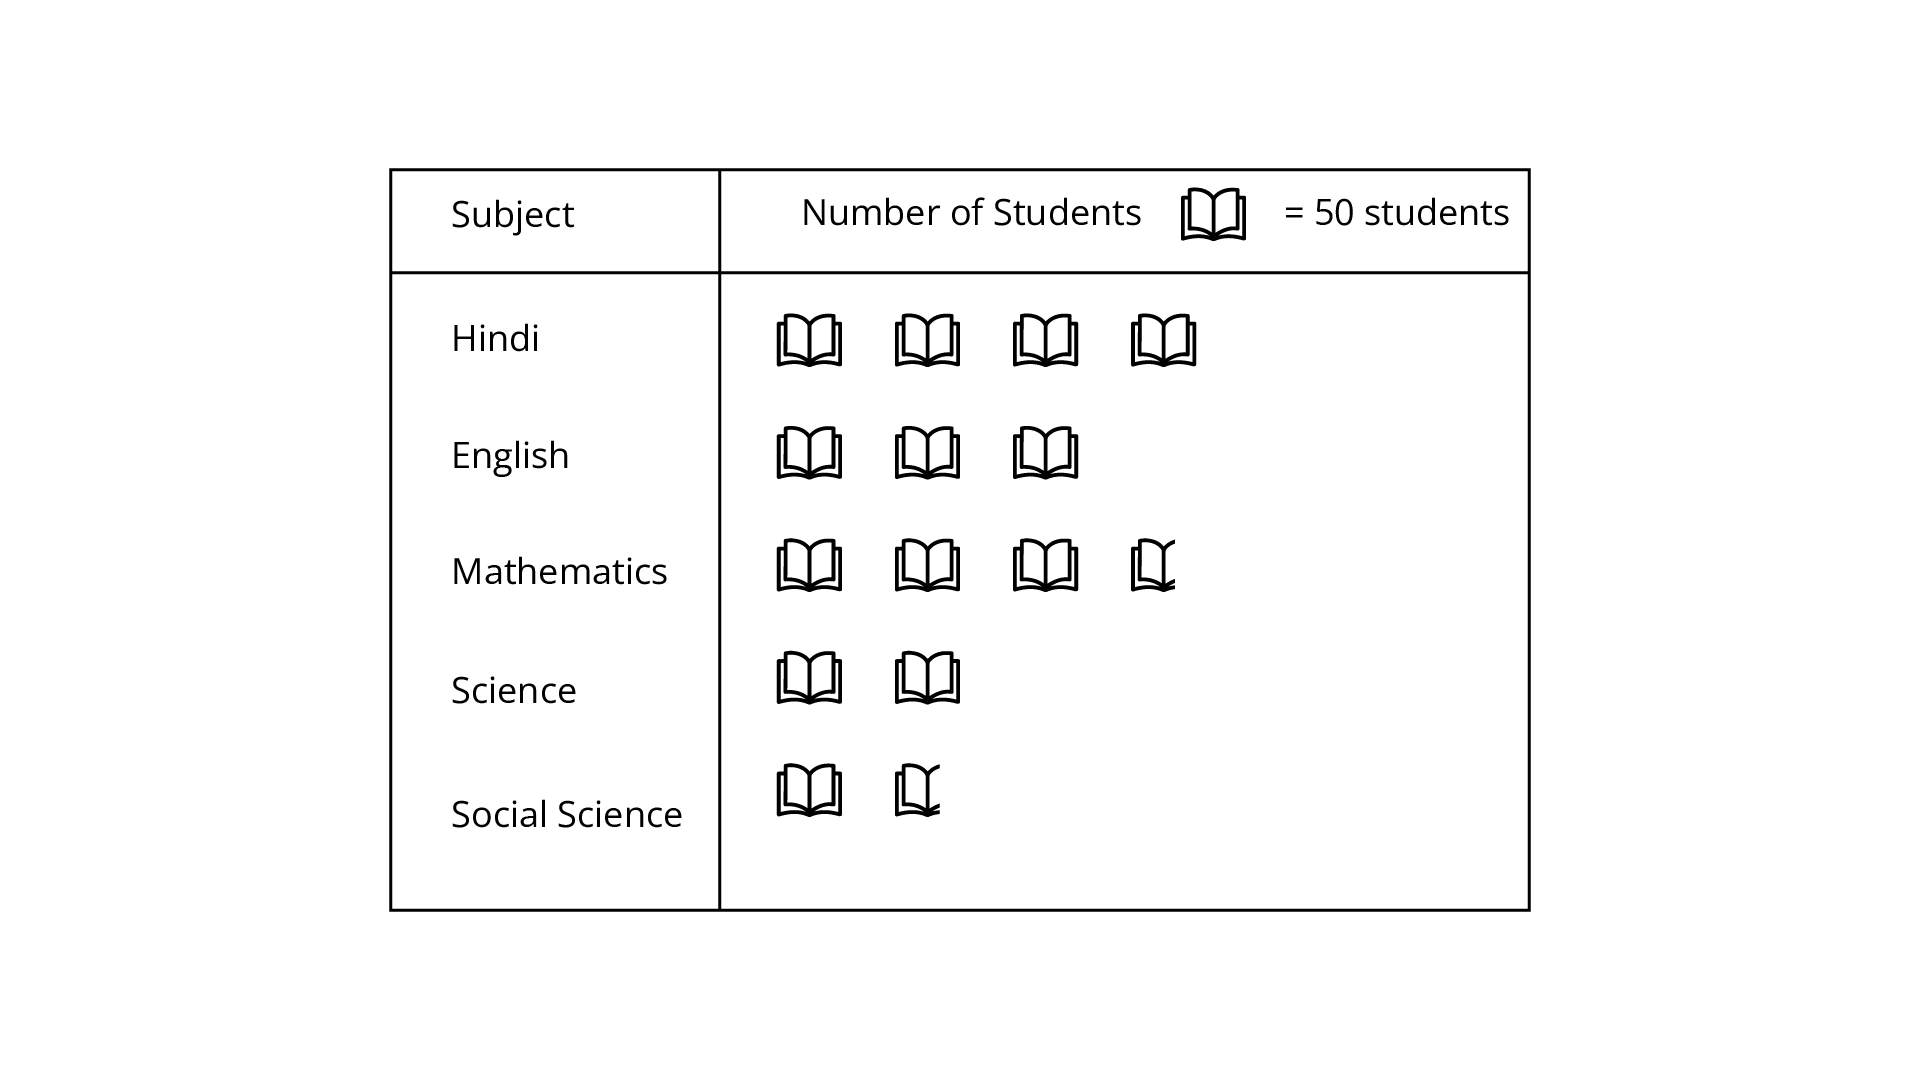
(a) Which subject is most popular among the students?
Ans: Subject Hindi is most popular among the students.
(b) How many students like Mathematics?
Ans: Total 175 students like Mathematics.
(c) Find the number of students who like subjects other than Mathematics and Science.
Ans: Total number of students who like Hindi,English and Social Studies=200+150+75=425 Students.
32. The following pictograph depicts the information about the areas in sq-km (to nearest hundred) of some districts of Chhattisgarh State:
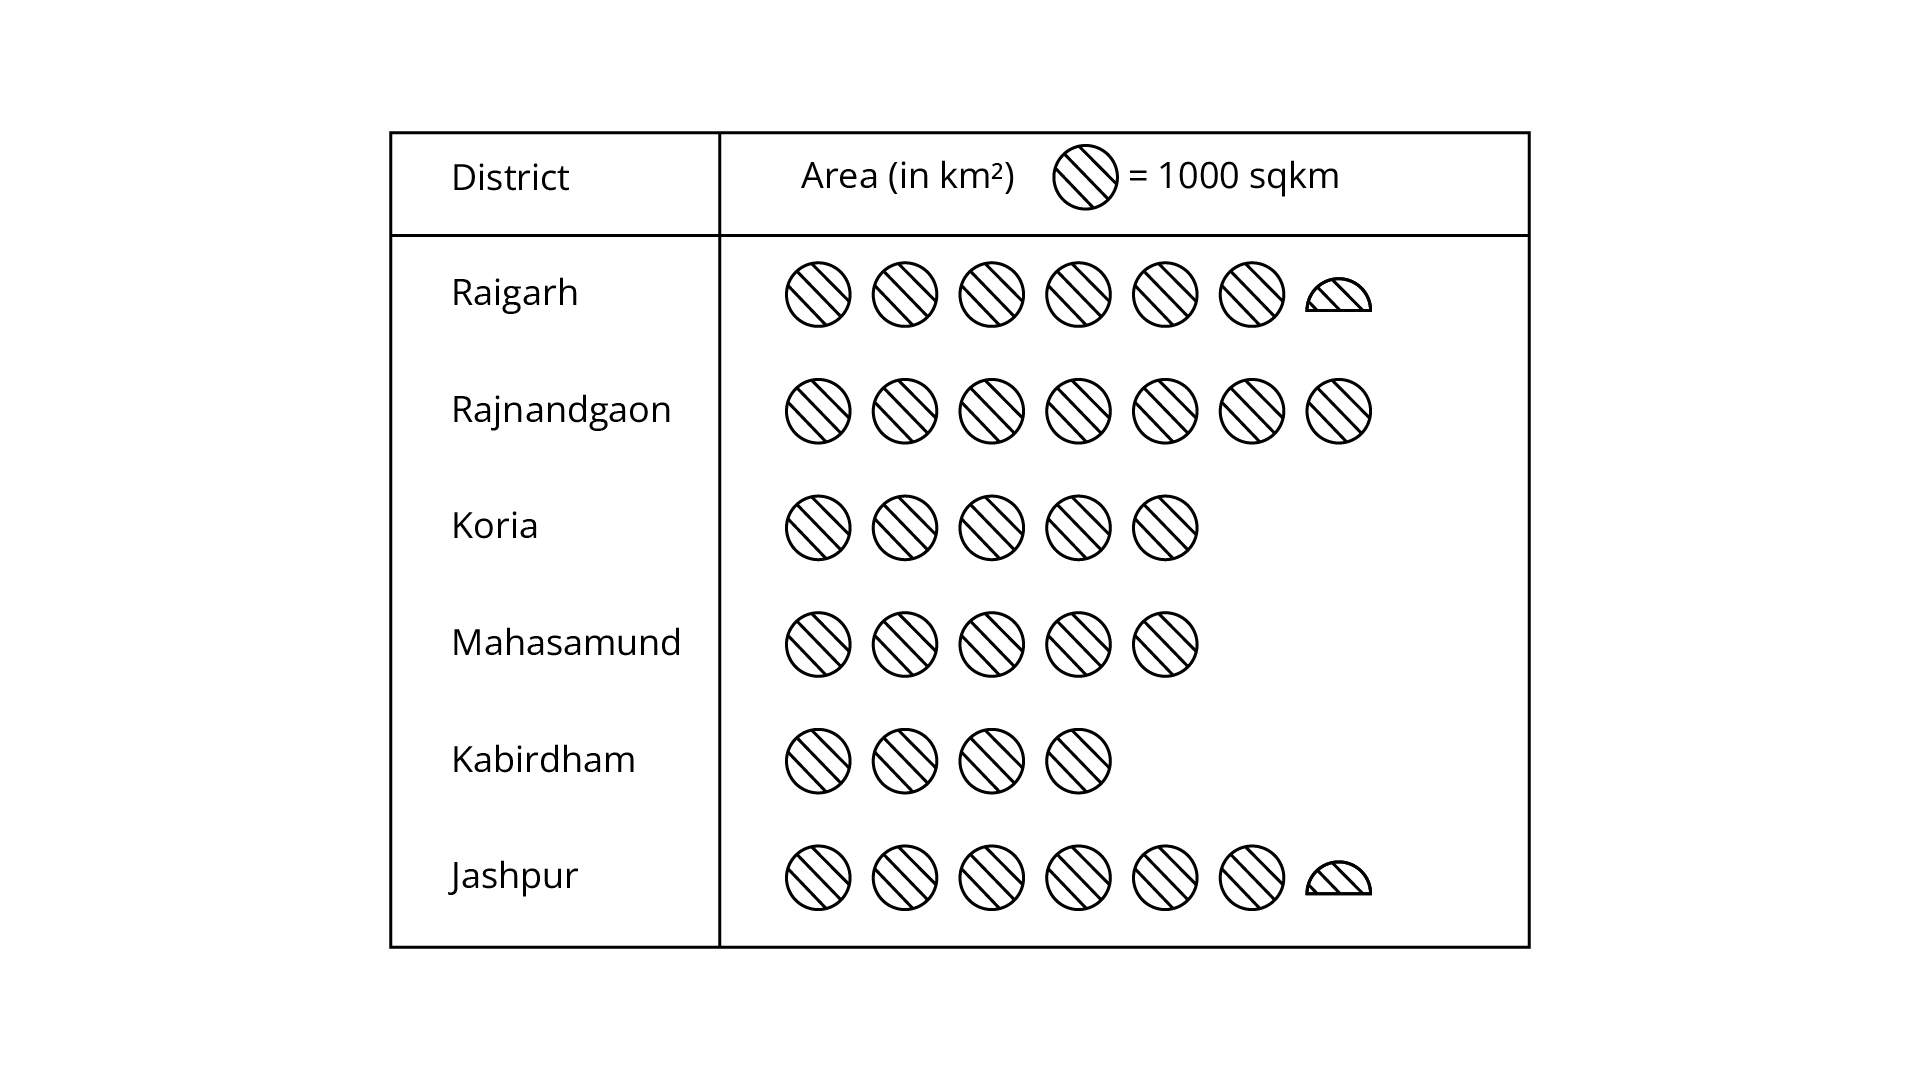
(a) What is the area of Koria district?
Ans: From the table the area of Koria district is 6000 sq km.
(b) Which two districts have the same area?
Ans: From the table Raigarh and Jashpur districts have the same area.
(c) How many districts have an area more than 5000 square kilometers?
Ans: From the table 4 districts have an area more than 5000 square kilometers.
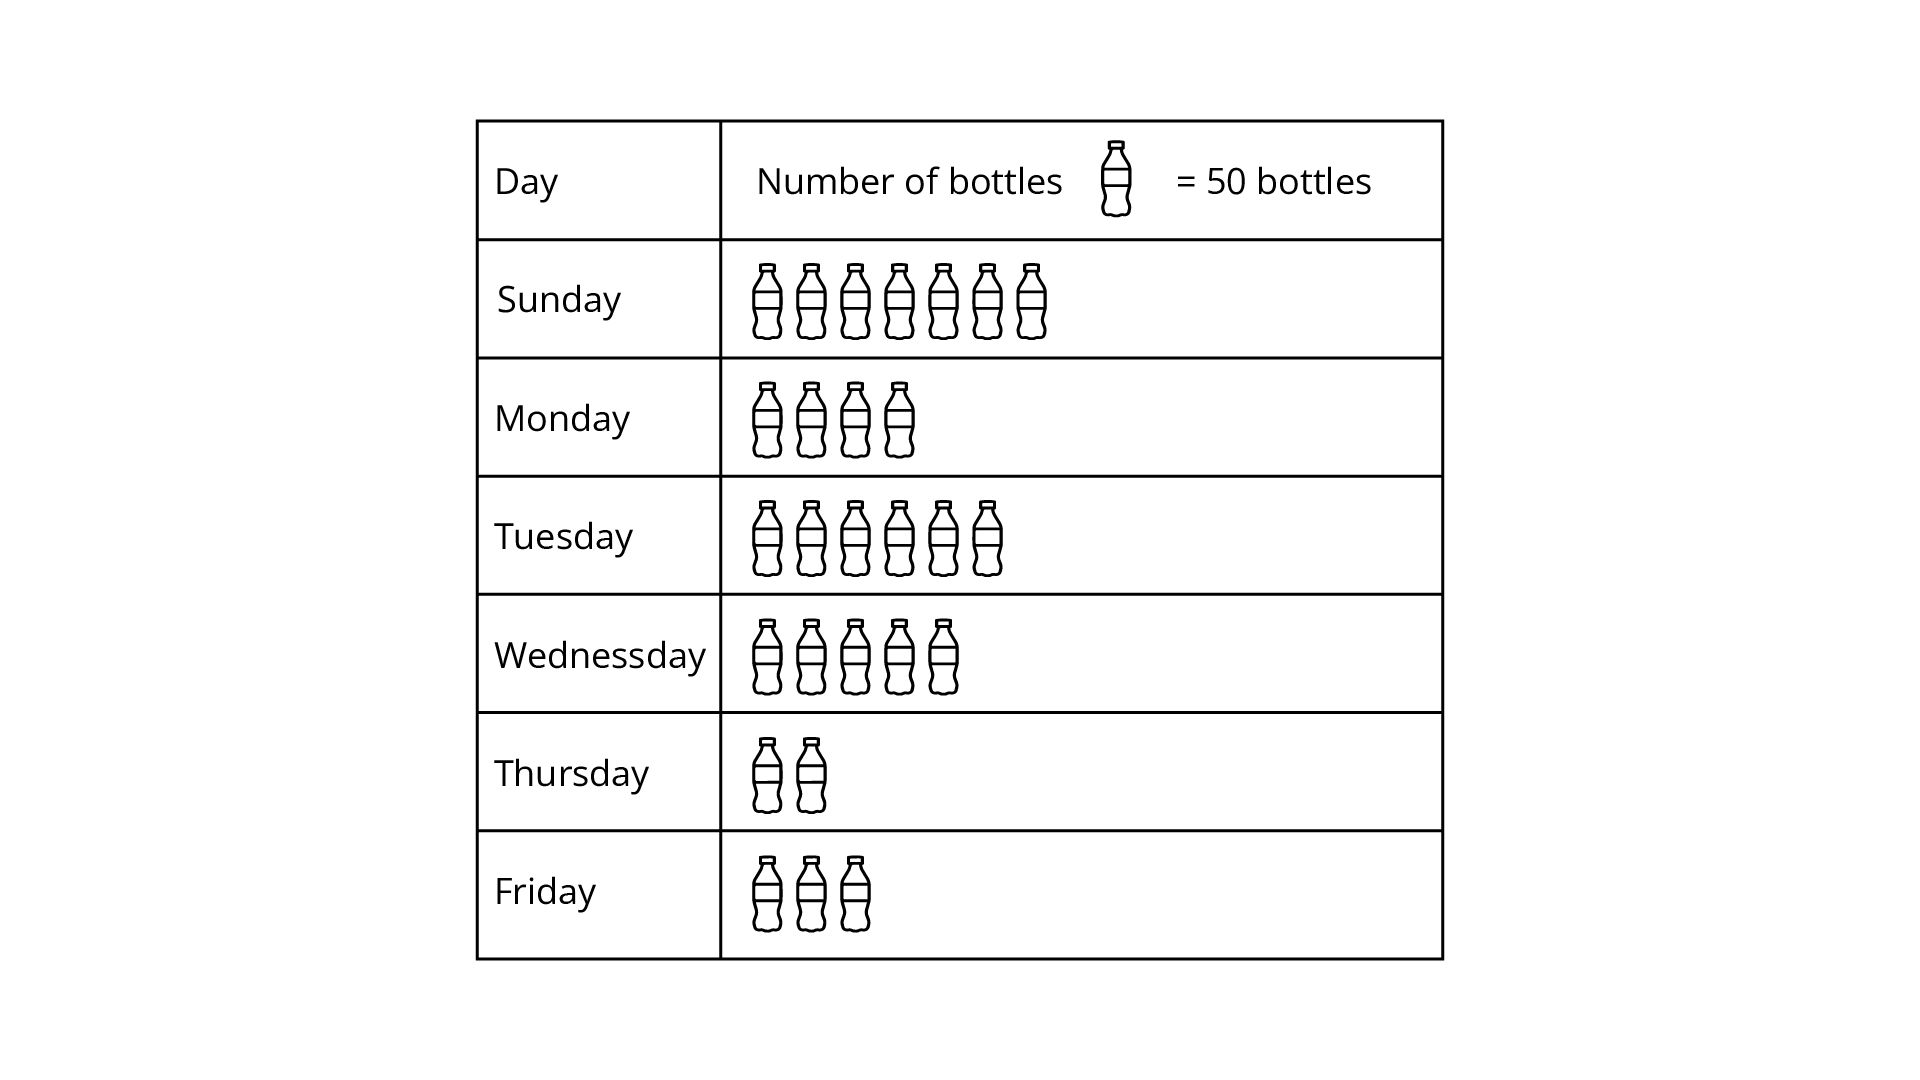
33. The number of bottles of cold drinks sold by a shopkeeper on six consecutive days is as follows:
Prepare a pictograph of the data using one symbol to represent 50 bottles.
Ans: Let one symbol of bottles be represented by 50 bottles.
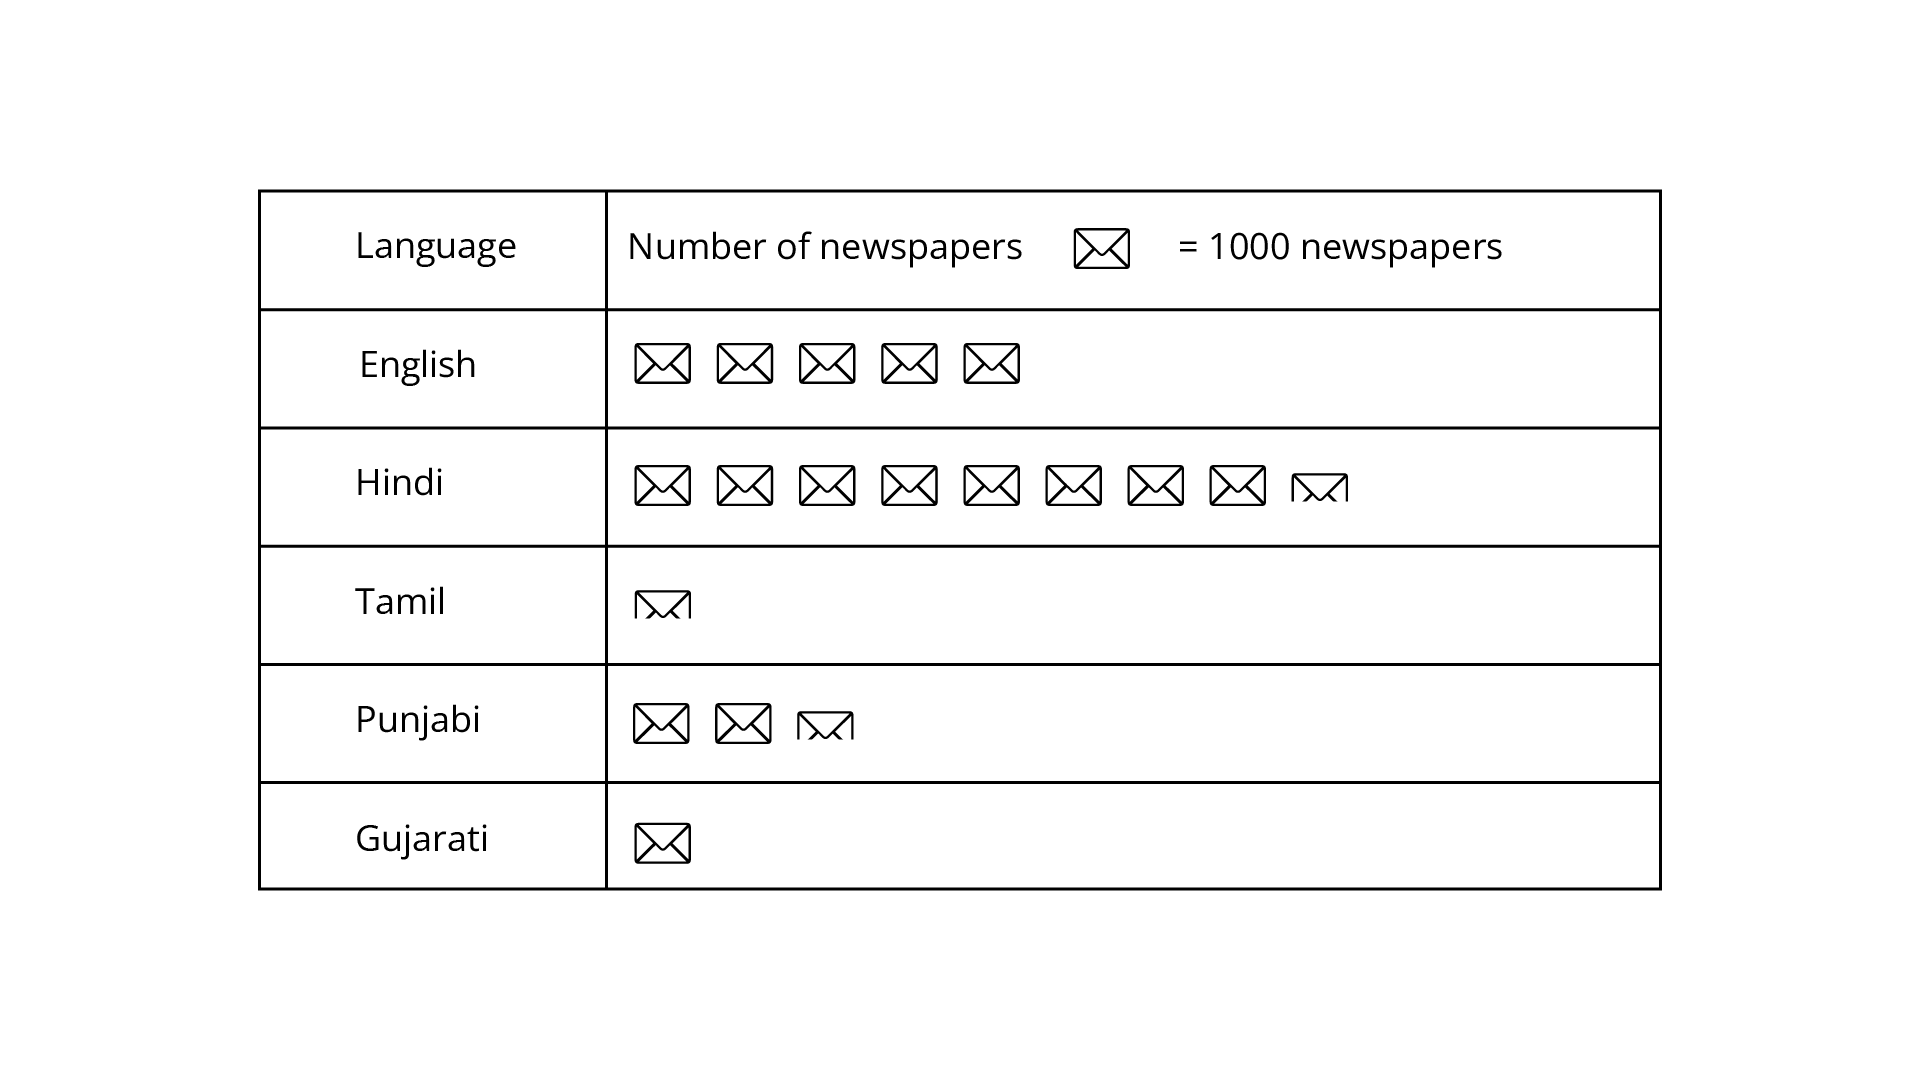
34. The following table gives information about the circulation of newspapers (dailies) in a town in five languages.
Prepare a pictograph of the above data, using a symbol of your choice, each representing 1000 newspapers.
Ans: Let one symbol of telegram represent 1000 newspapers.
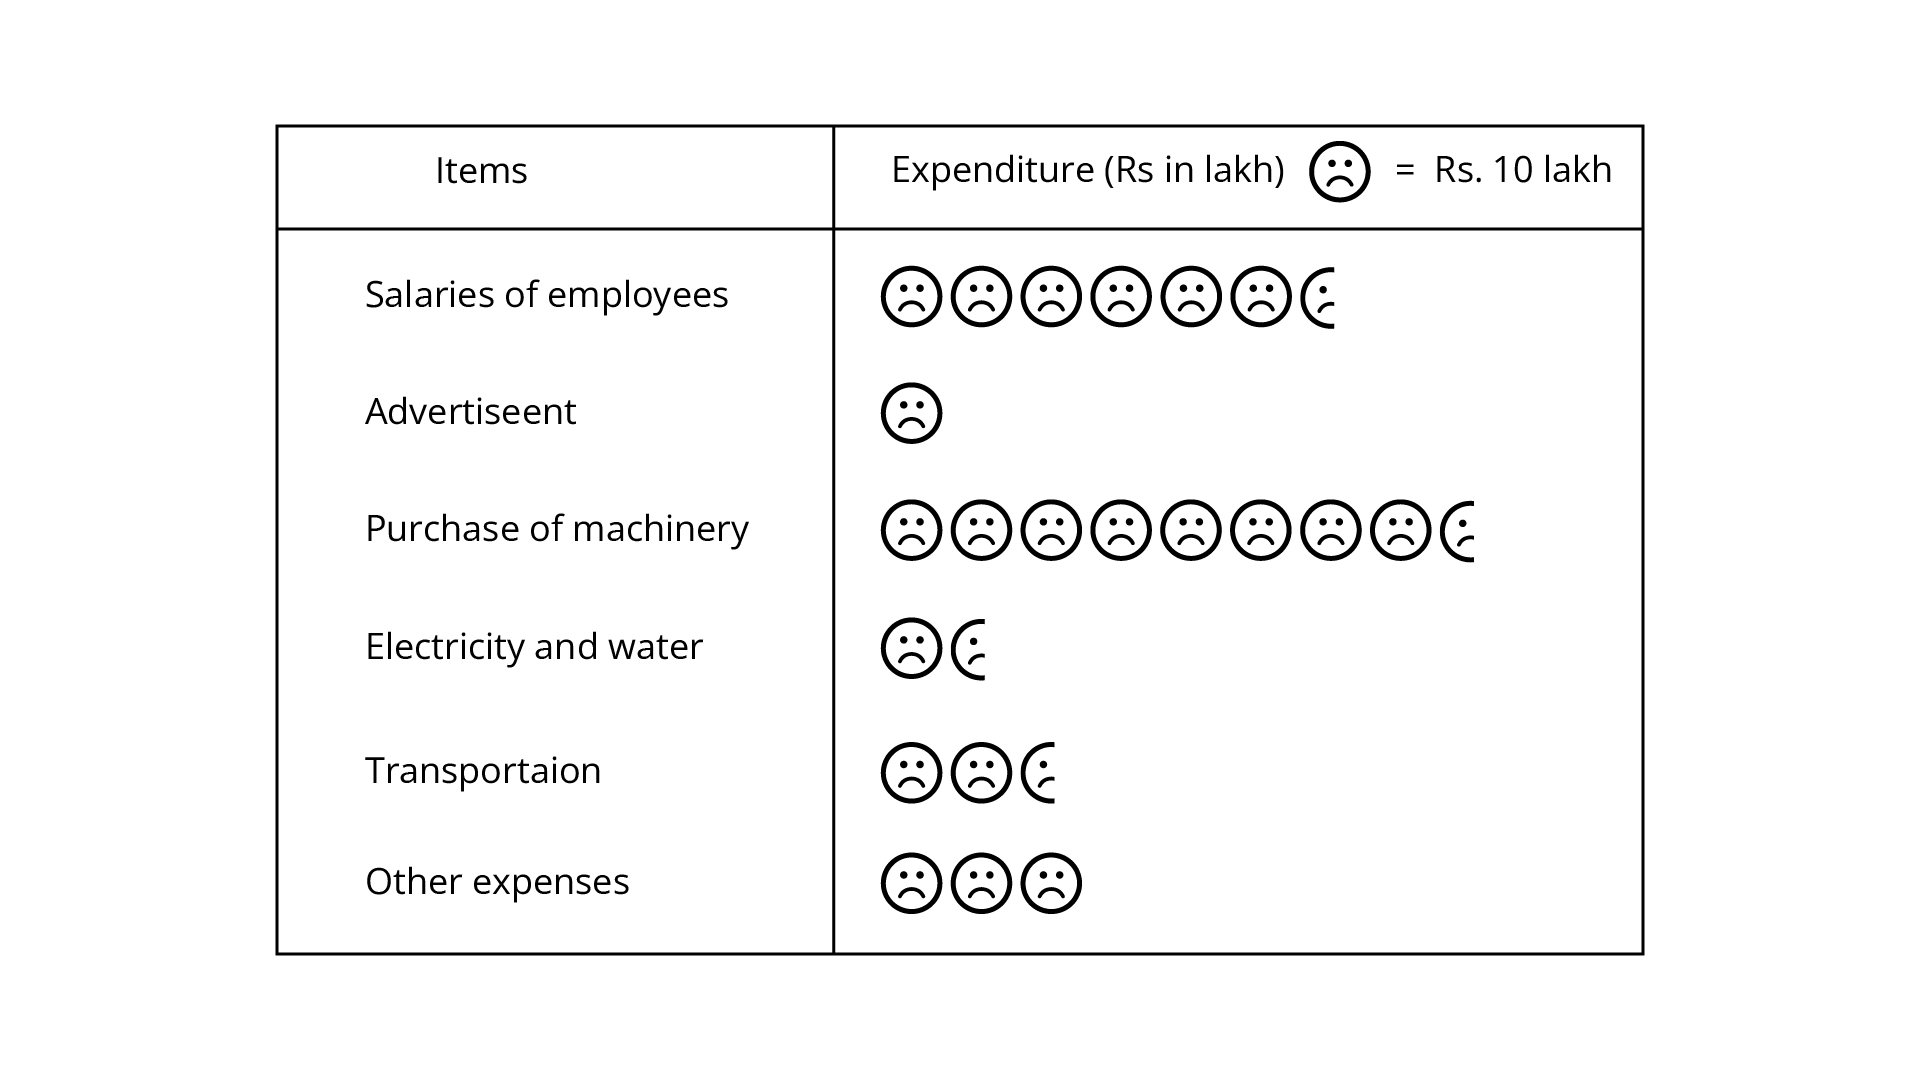
35. Annual expenditure of a company in the year 2007-2008 is given below:
Prepare a pictograph of the above data using an appropriate symbol to represent Rs 10 lakh.
Ans: Let one symbol represent 10 lakh Expenditure.
36. The following bar graph shows the number of houses (out of 100) in a town using different types of fuels for cooking. Read the bar graph and answer the following questions:
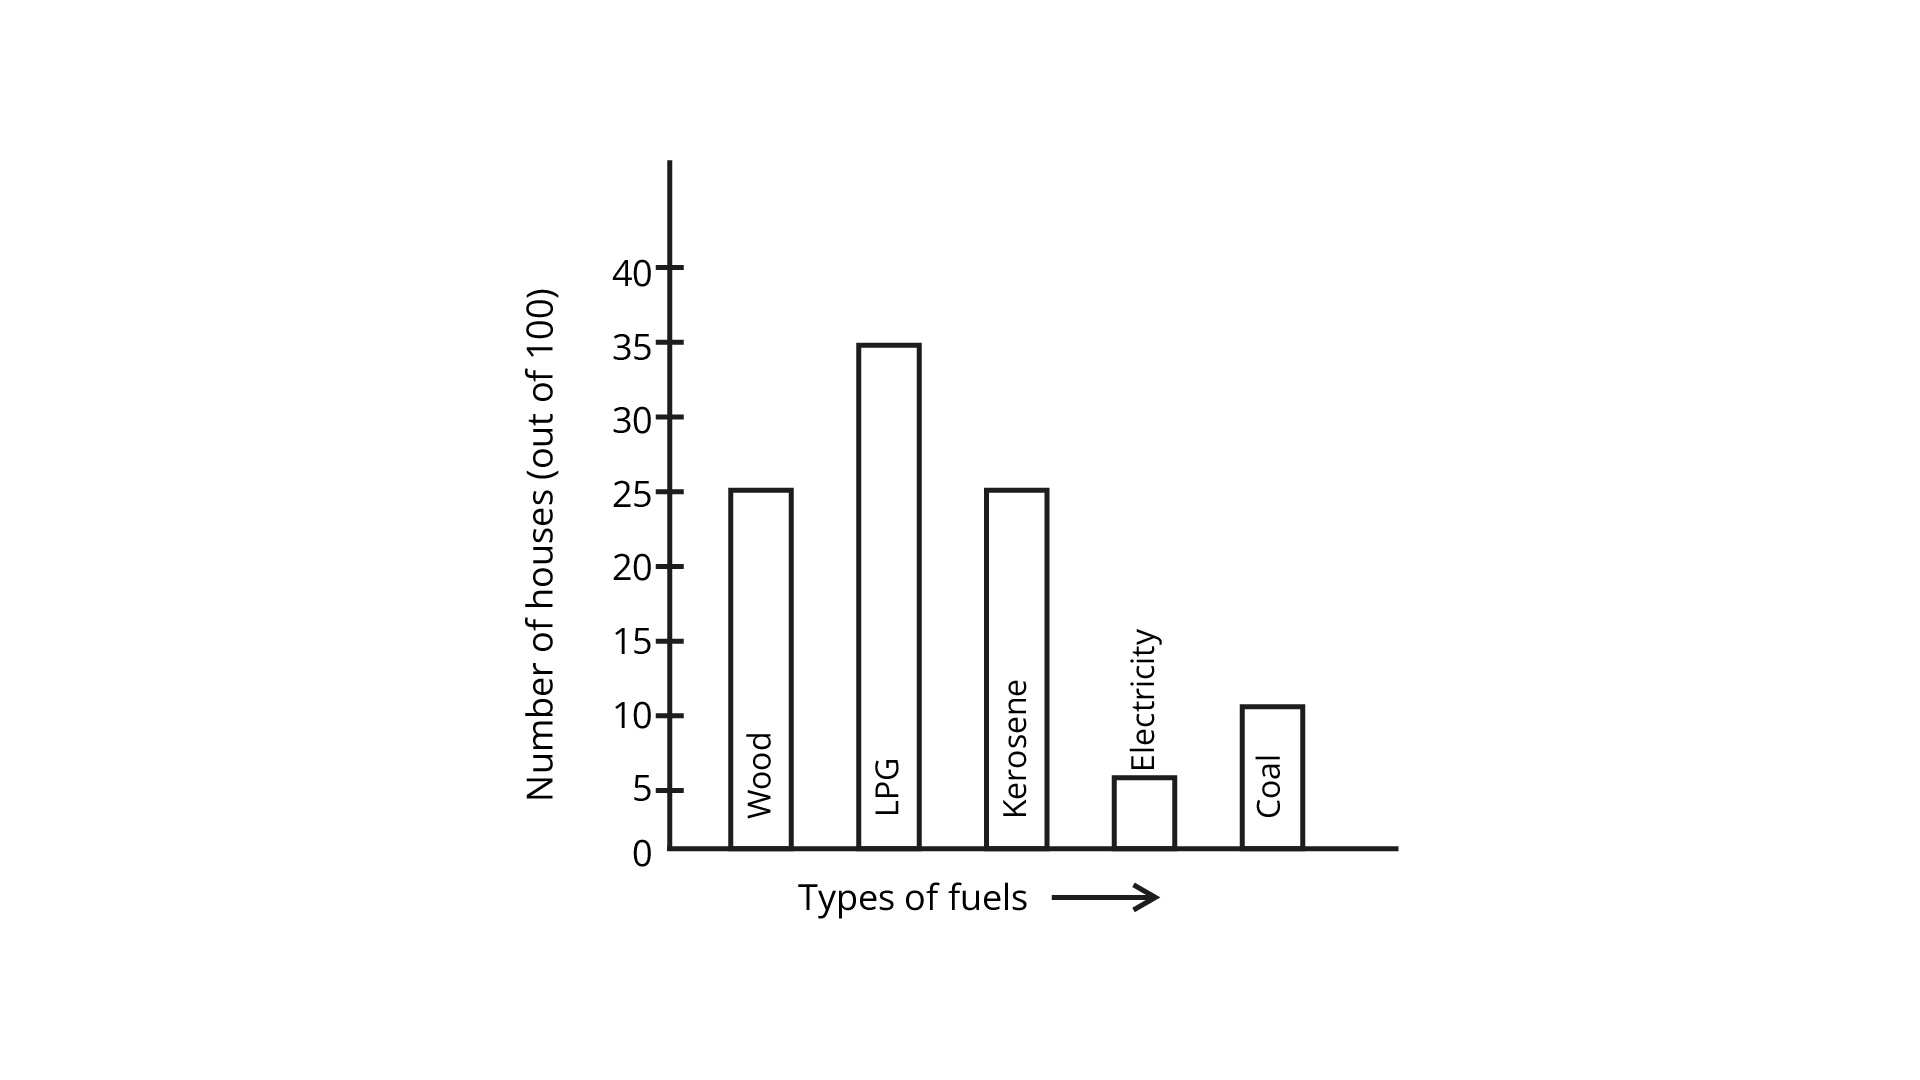
(a) Which fuel is used in a maximum number of houses?
Ans: From the given bar graph LPG fuel is used in a maximum number of houses.
(b) How many houses are using coal as fuel?
Ans: 10 houses out of 100 are using coal as fuel.
(c) Suppose that the total number of houses in the town is 1 lakh. From the above graph estimate, the number of houses using electricity.
Ans: The number of houses using electricity out of 100 = 5 number of houses using electricity out of 1 lakh will be
$\frac{5}{100}$$\times 1 lakh$
=$\frac{5}{100}$$\times 100000$
=5000 houses
37. The following bar graph represents the data for different sizes of shoes worn by the students in a school. Read the graph and answer the following questions.
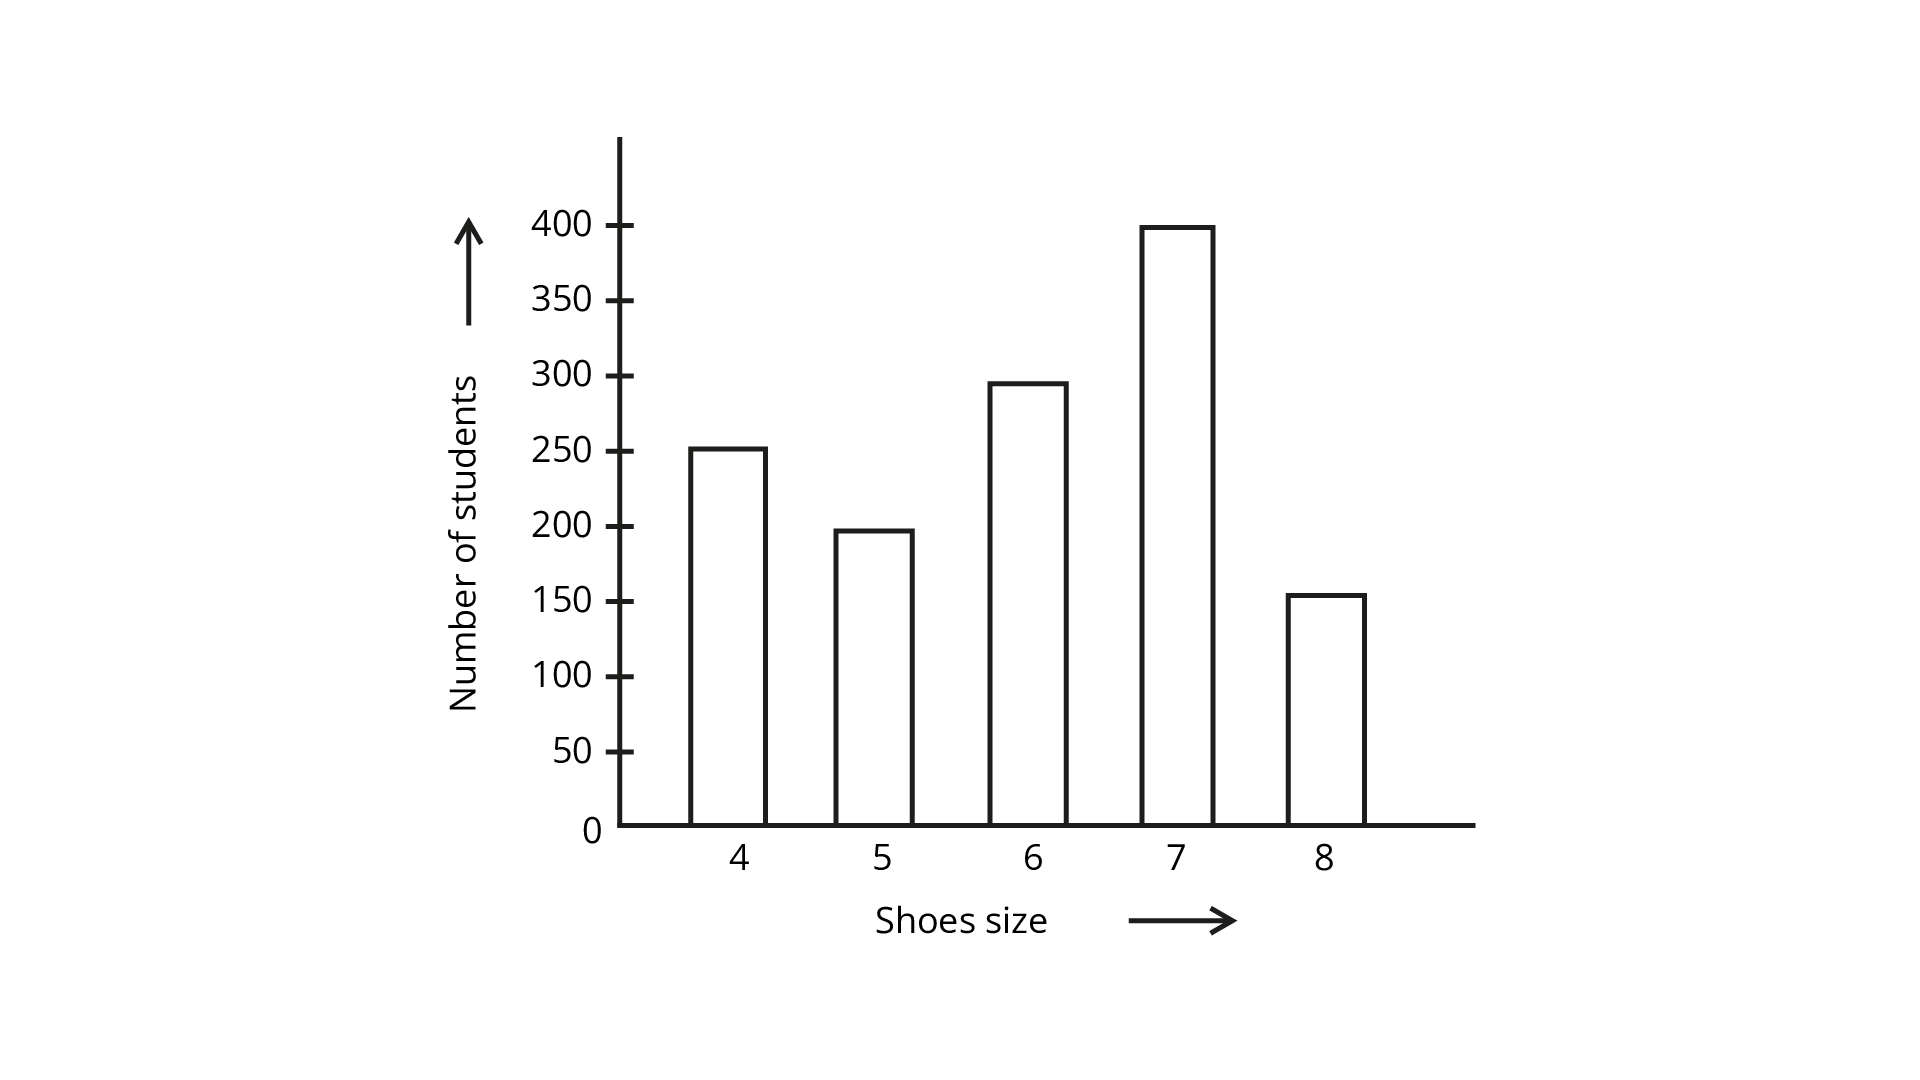
(a) Find the number of students whose shoe sizes have been collected.
Ans: Total number of students= 250+200+300+400+150=1300.
(b) What is the number of students wearing shoe size 6?
Ans: 300 students are wearing shoe size 6.
(c) What are the different sizes of the shoes worn by the students?
Ans: 5 types of shoes worn by the students - 4, 5, 6, 7 and 8 .
(d) Which shoe size is worn by the maximum number of students?
Ans: Shoe number 7 is worn by the maximum number of students.
(e) Which shoe size is worn by a minimum number of students?
Ans: Shoe number 8 is worn by the minimum number of students.
(f) State whether true or false:
The total number of students wearing shoe sizes 5 and 8 is the same as the number of students wearing shoe size 6. Solution:
Ans: False
Because the total number of students wearing shoe sizes 5 and 8 = 350
And the number of students wearing shoe size 6 = 300.
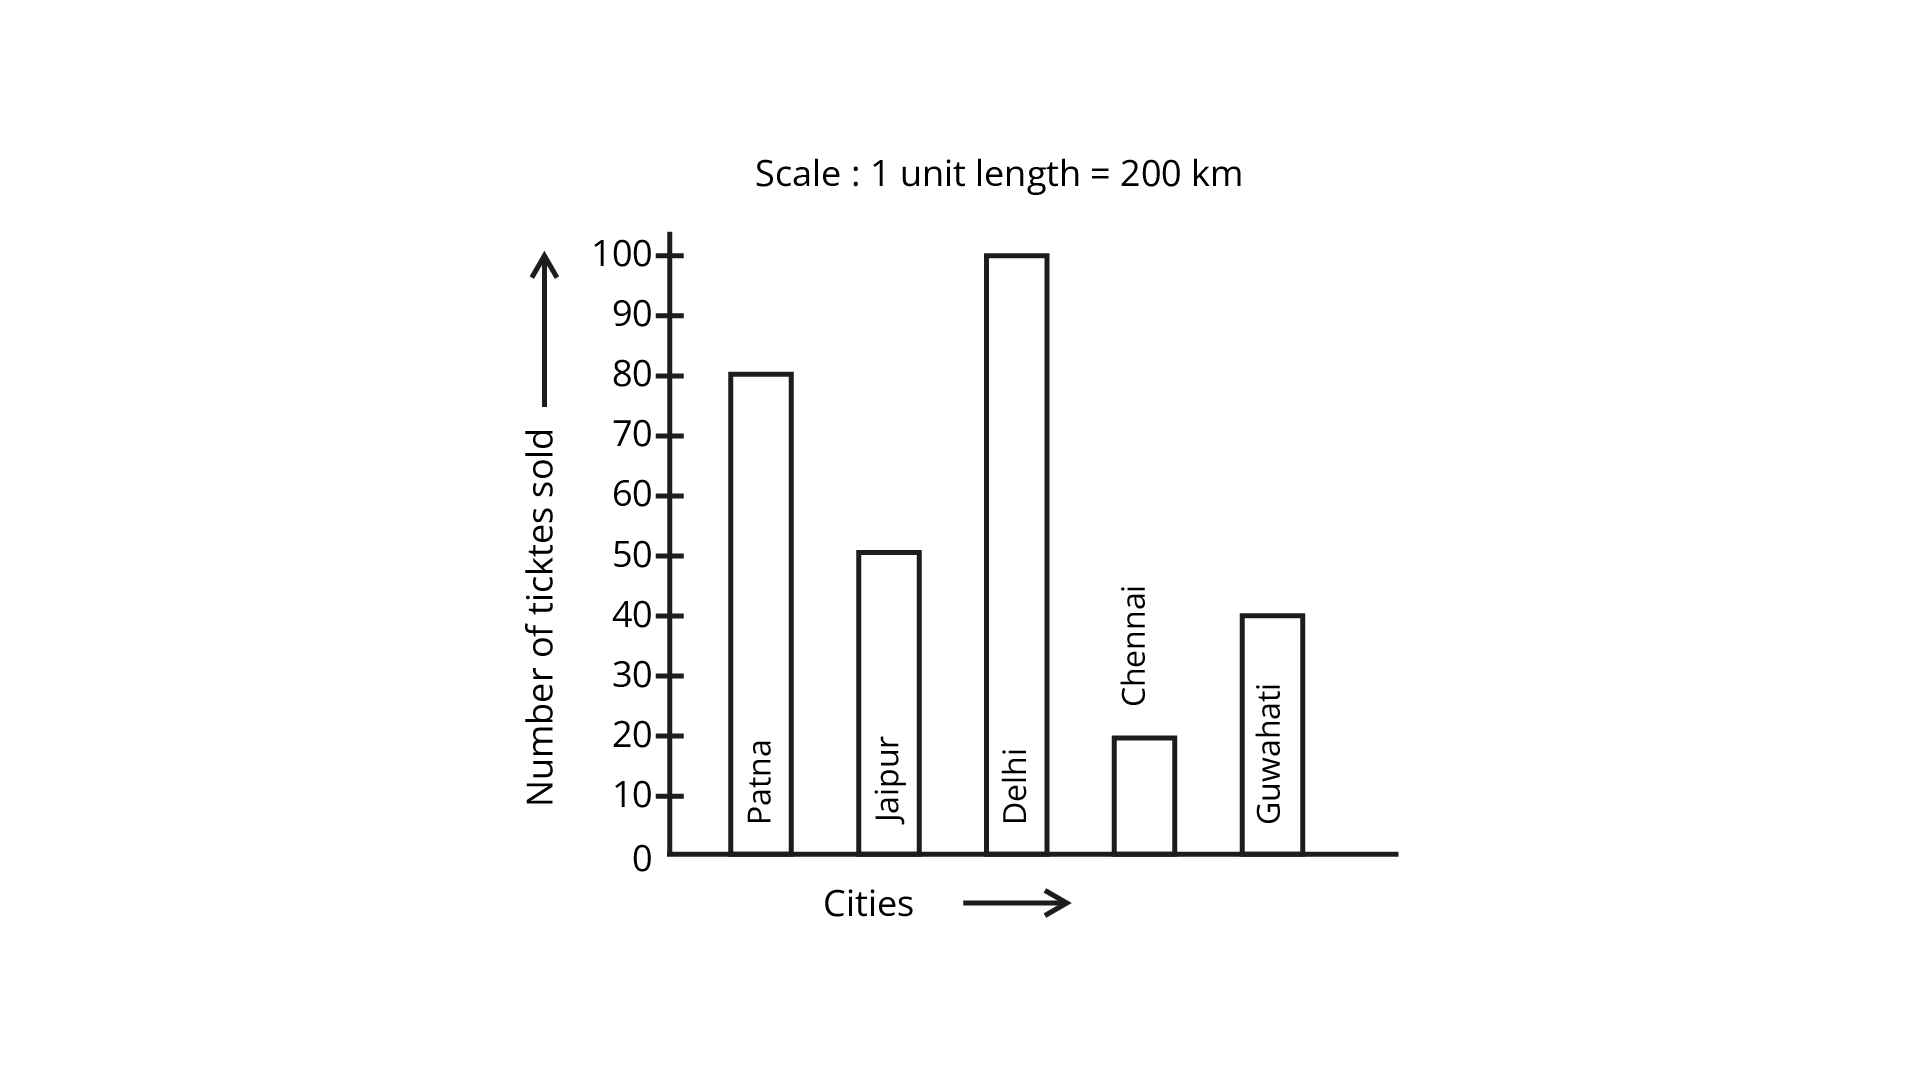
38. The following graph gives information about the number of railway tickets sold for different cities on a railway ticket counter between 6.00 am to 10.00 am. Read the bar graph and answer the following questions:
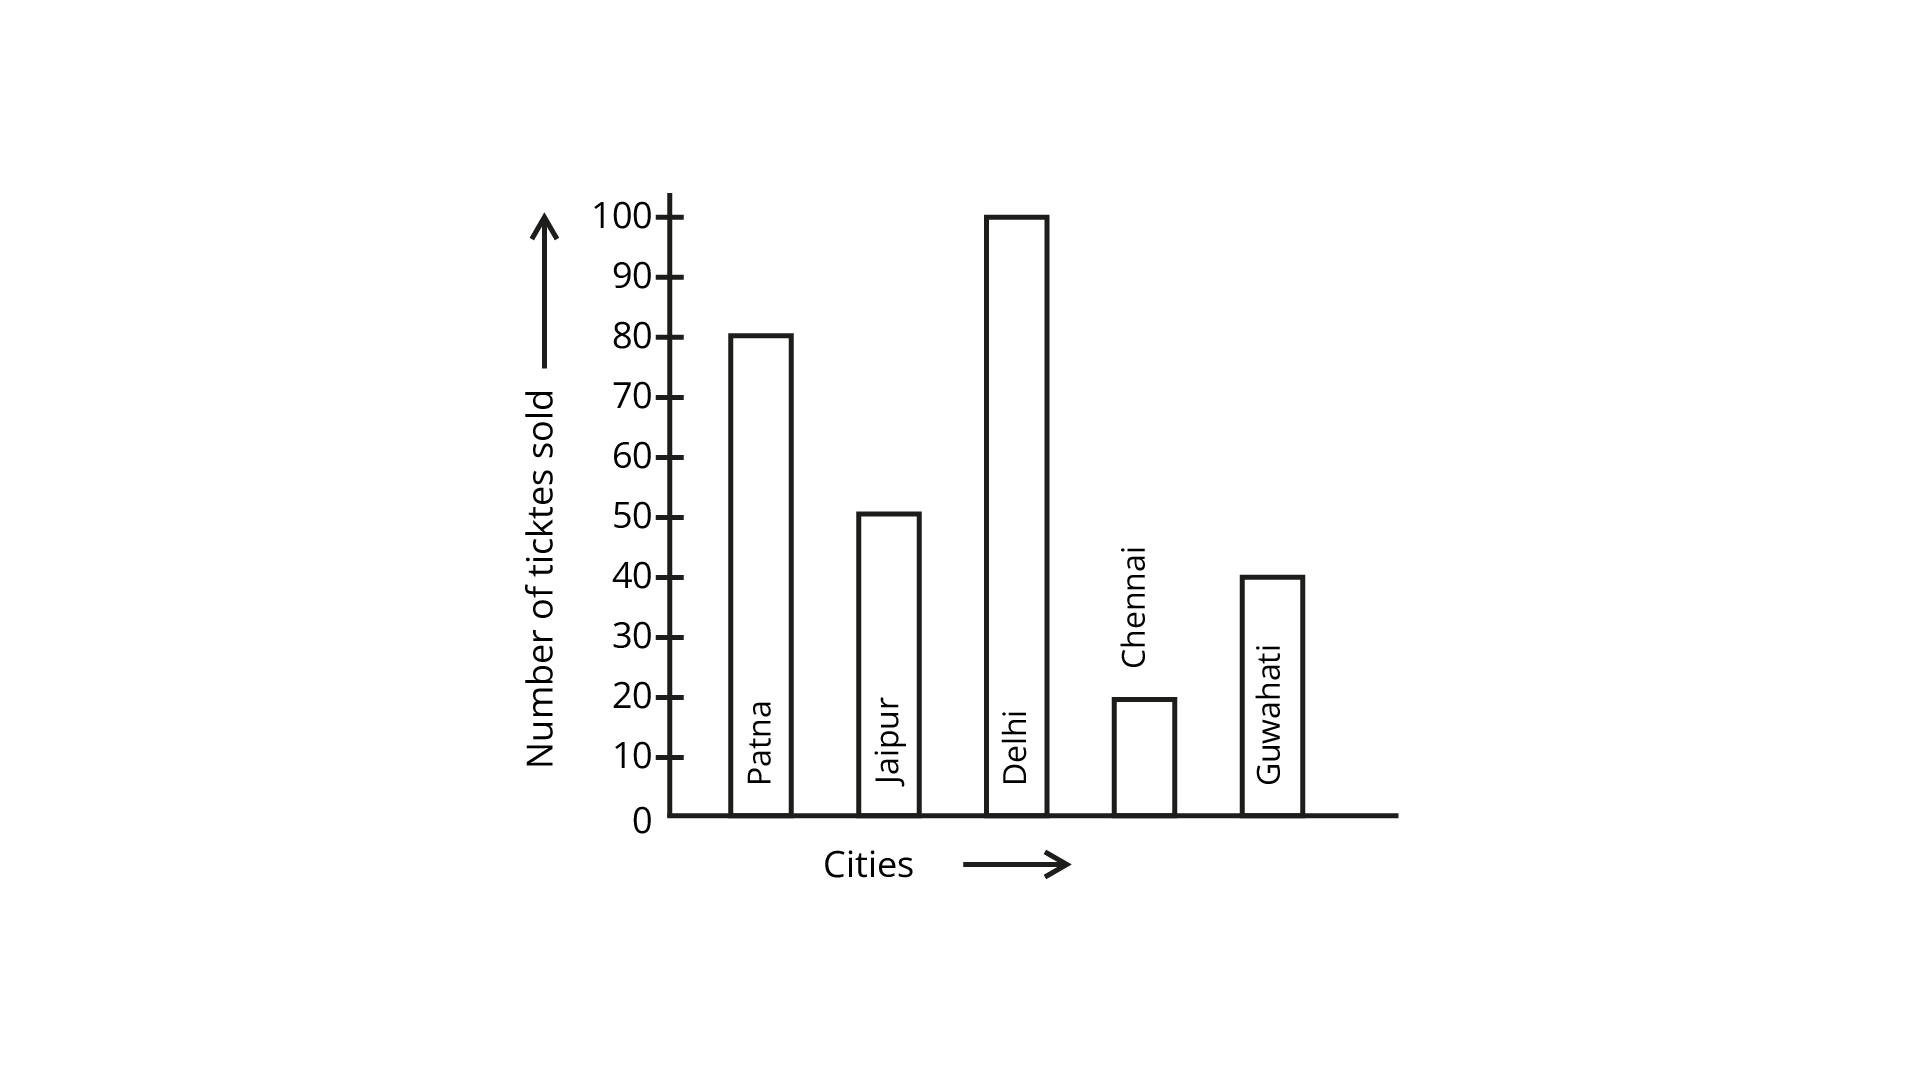
(a) How many tickets were sold in all?
Ans: Number of total ticket sold = 80+50 + 100+20+40 = 290
(b) For which city were the maximum numbers of tickets sold?
Ans: Maximum number of tickets were sold in Delhi and that is 100.
(c) For which city were the minimum numbers of tickets sold?
Ans: Minimum number of tickets were sold for Chennai and that is 20.
(d) Name the cities for which the number of tickets sold is more than 20.
Ans: The number of tickets sold is more than 20 the cities are Patna, Jaipur, Delhi and Guwahati.
(e) Fill in the blanks:
Number of tickets sold for Delhi and Jaipur together exceeds the total number of tickets sold for Patna and Chennai by……..
Ans: Number of tickets sold for Delhi and Jaipur together exceeds the total number of tickets sold for Patna and Chennai by 50.
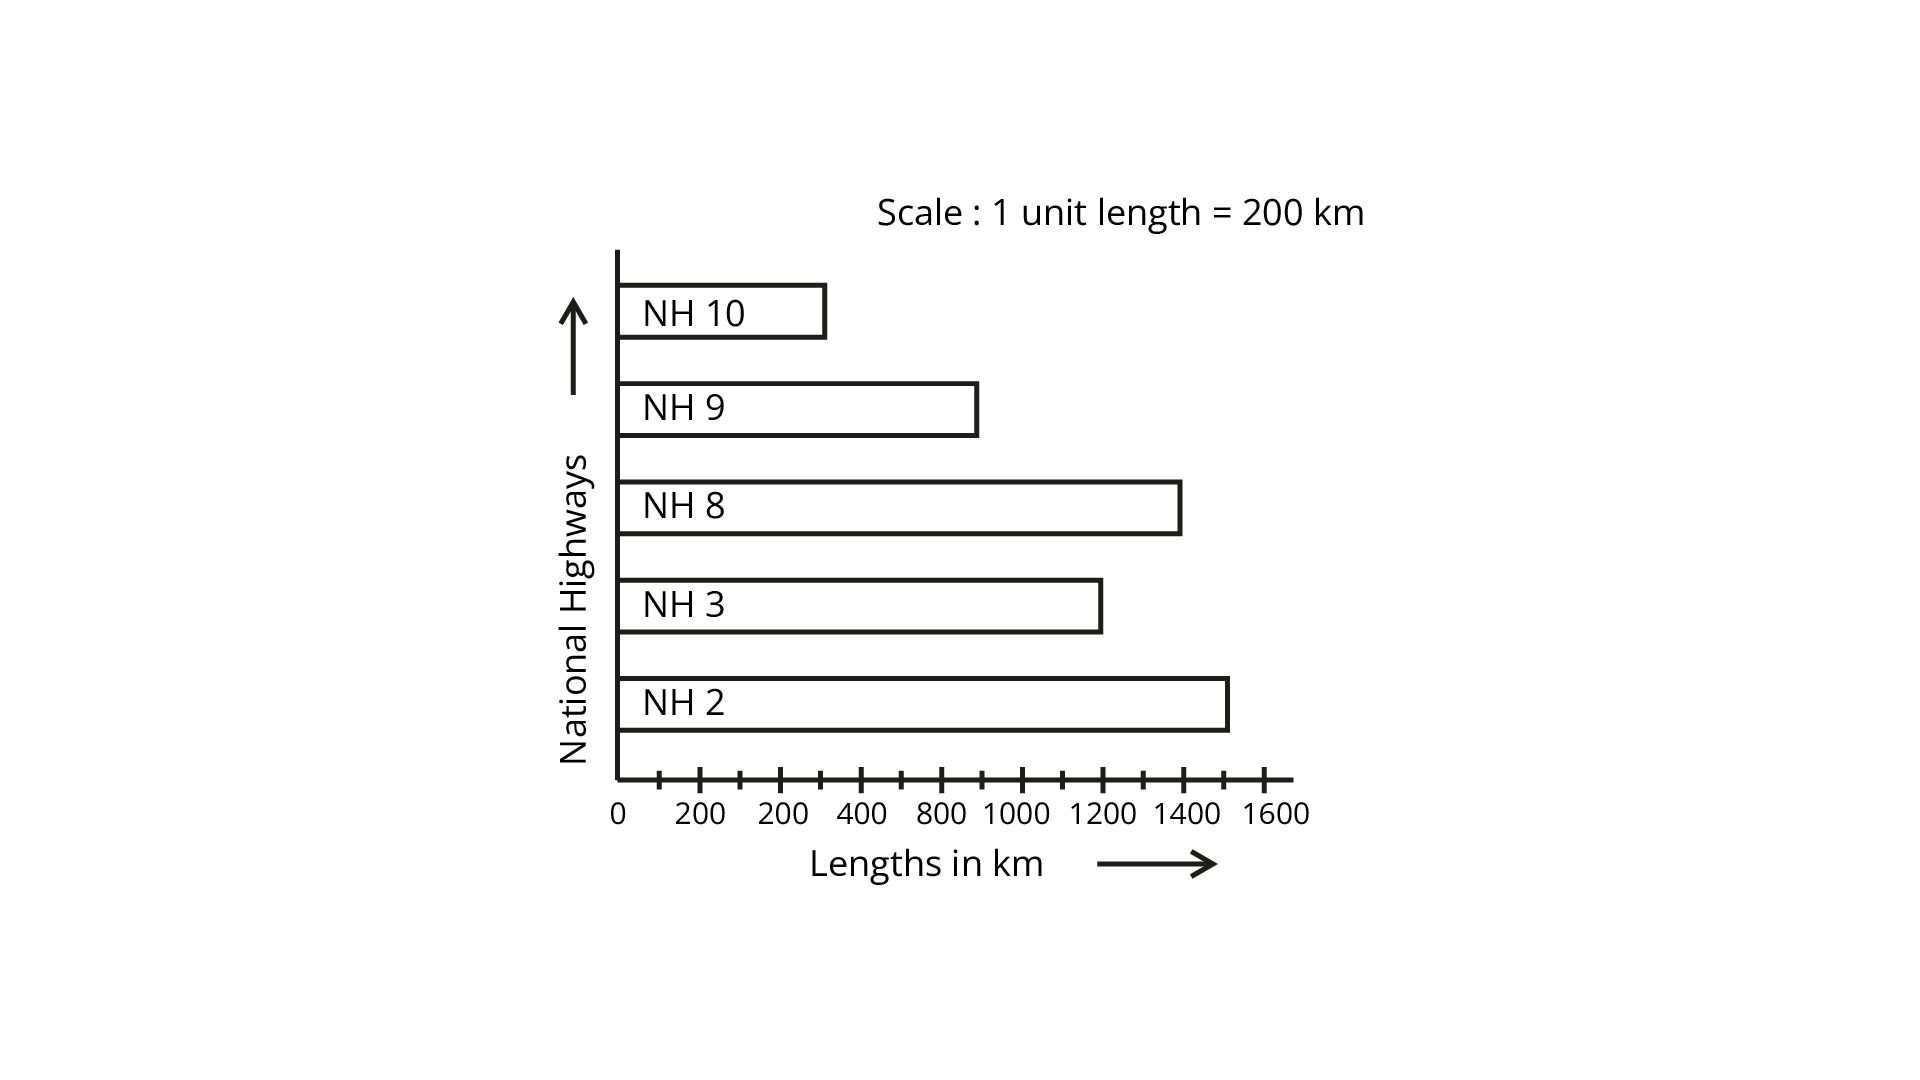
39. The bar graph given below represents approximate length (in kilometers) of some National Highways in India. Study the bar graph and answer the following questions:
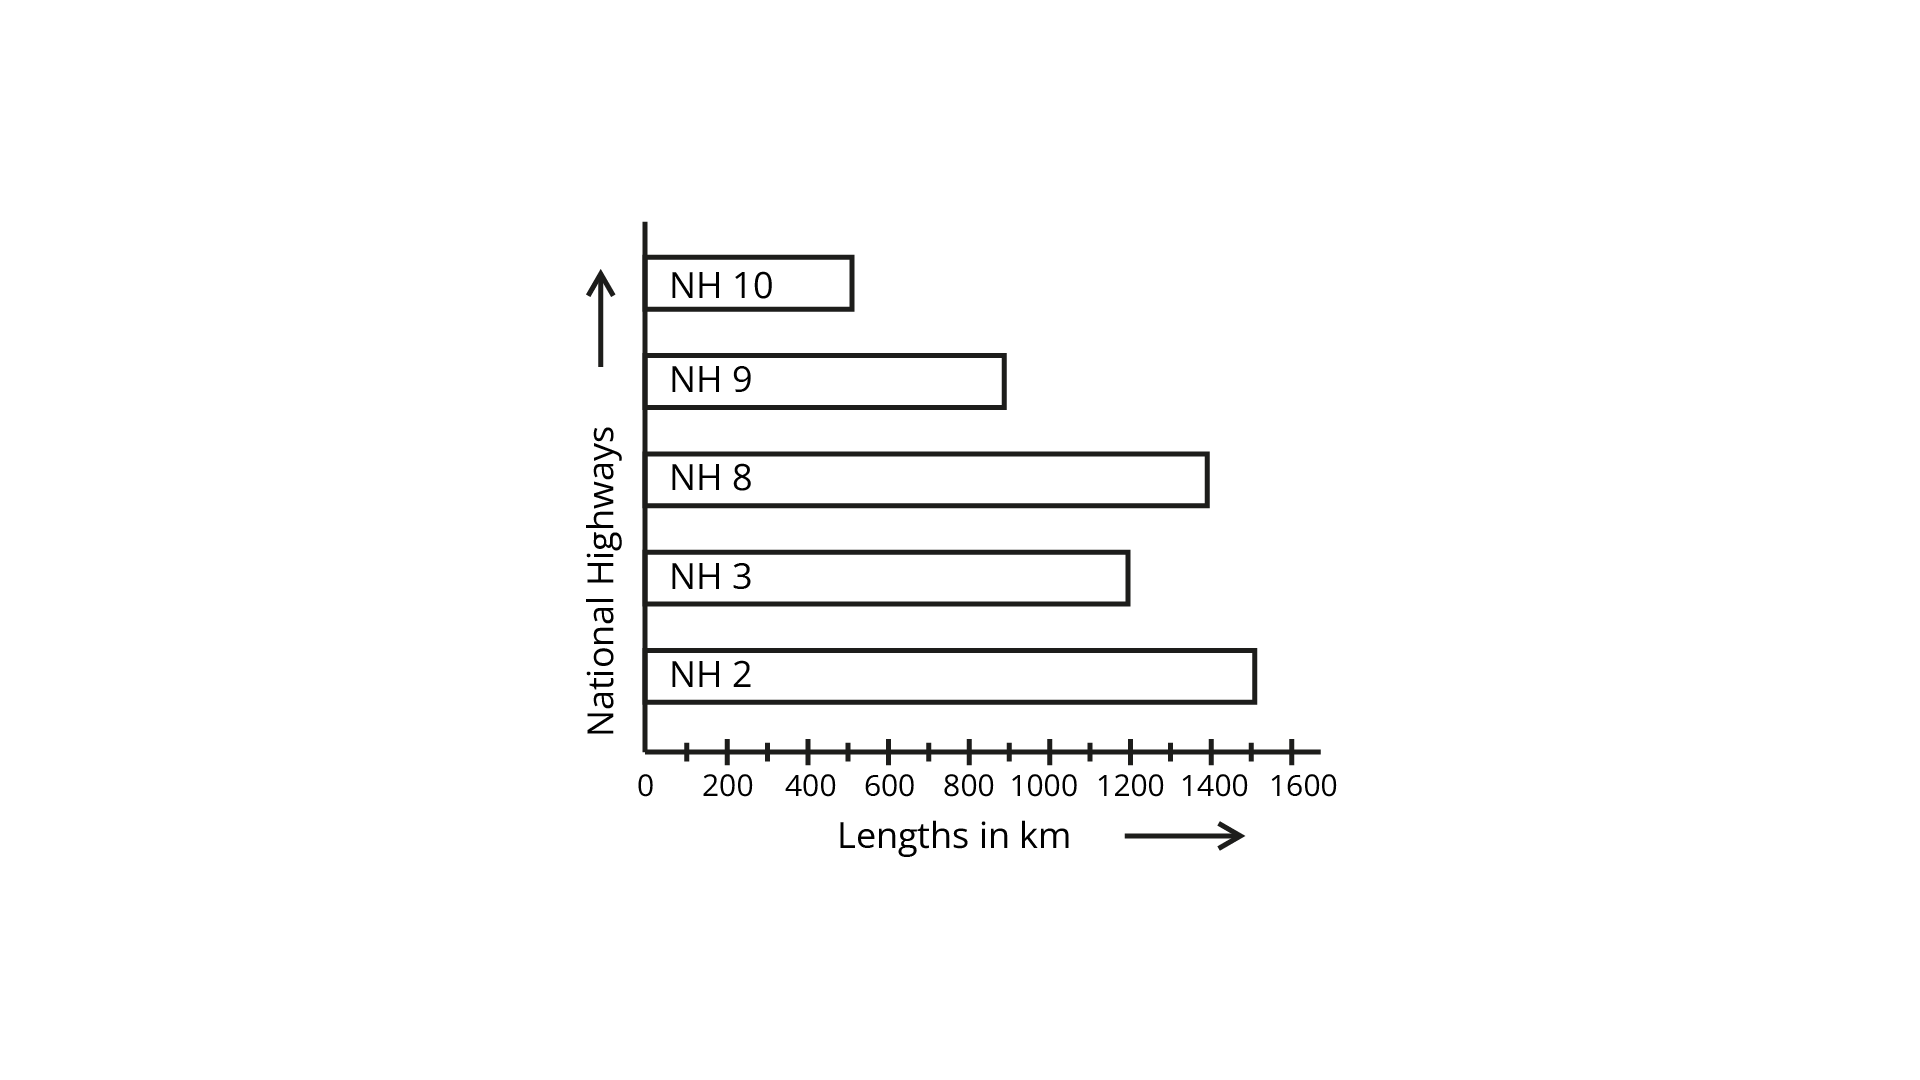
(a) Which National Highway (N.H.) is the longest among the above?
Ans: From the given bar graph N.H 2 is the longest National Highway.
(b) Which National Highway is the shortest among the above?
Ans: From the given bar graph N.H 10 is the shortest National Highway.
(c) What is the length of National Highway 9?
Ans: Length of N.H 9 is 900 km.
(d) Length of which National Highway is about three times the National Highway 10?
Ans: From the given bar graph N.H 8 is (1400 km) about three times of N.H 10 (450km).
40. The bar graph given below represents the circulation of newspapers in different languages in a town. Study the bar graph and answer the following questions:
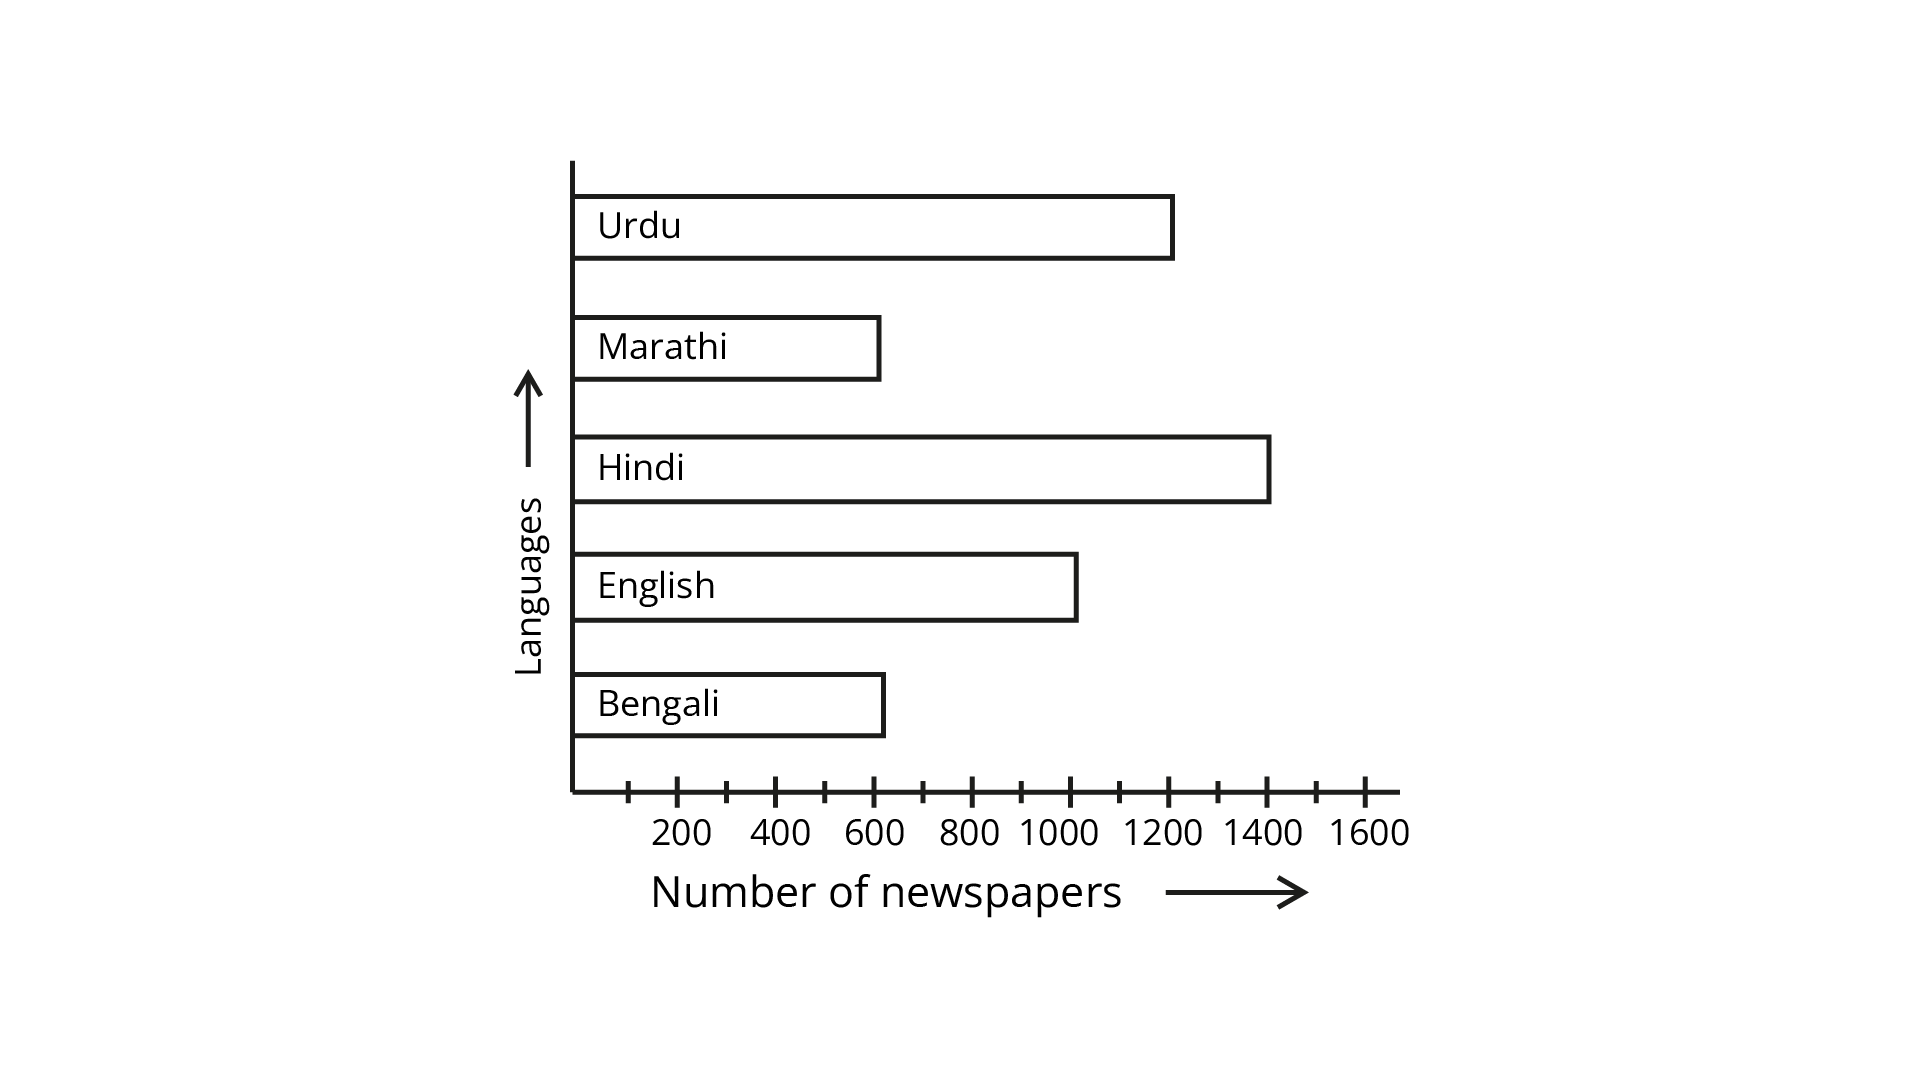
(a) What is the circulation of the English newspaper?
Ans: From the given bar graph 1000 English newspapers are in circulation.
(b) Name the two languages in which the circulation of the newspaper is the same.
Ans: From the given bar graph in Bengali and Marathi languages in which the circulation of the newspaper is the same.
(c) By how much is the circulation of newspapers in Hindi more than the newspaper in Bengali?
Ans: From the given bar graph circulation of newspapers in Hindi =1400
circulation of newspapers in Bengali=600
So, the difference = 1400 - 600= 800
The circulation of newspapers in Hindi is 800 more than the newspapers in Bengali.
41. Read the bar graph given below and answer the following questions:
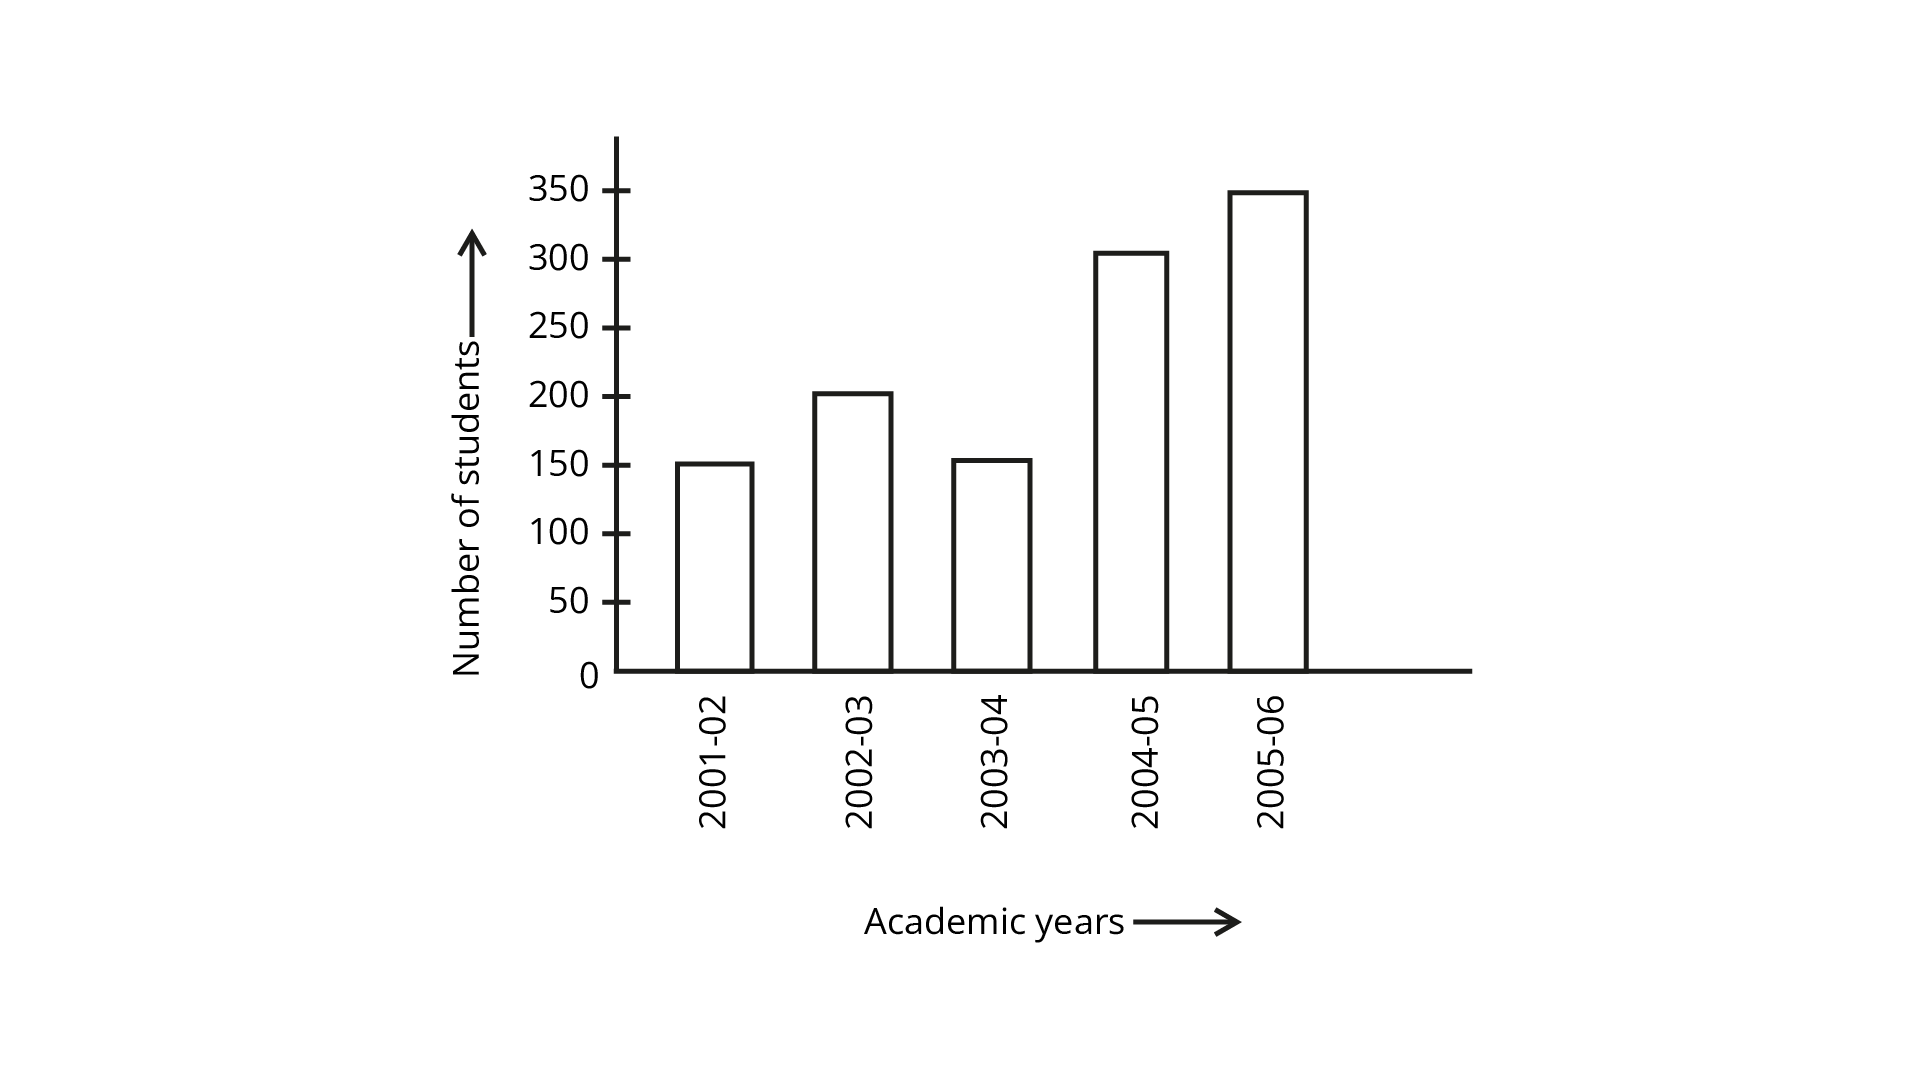
(a) What information is given by the bar graph?
Ans: The bar graph shows Increment and decrement of students per year.
(b) In which year is the number of students maximum?
Ans: From the given bar graph in 2005-06 the number of students is maximum.
(c) In which year is the number of students twice as that of 2001-02?
Ans: From the given bar graph the number of students in the academic year 2004-05 is twice as that of 2001-02.
(d) In which year did the number of students decrease as compared to the previous year?
Ans: From the given bar graph the number of students in 2003-04 decreased as compared to 2002-03.
(e) In which year is the increase in the number of student's maximum as compared to the previous year?
Ans: From the given bar graph in 2004-05 maximum increased as compared to the previous year.
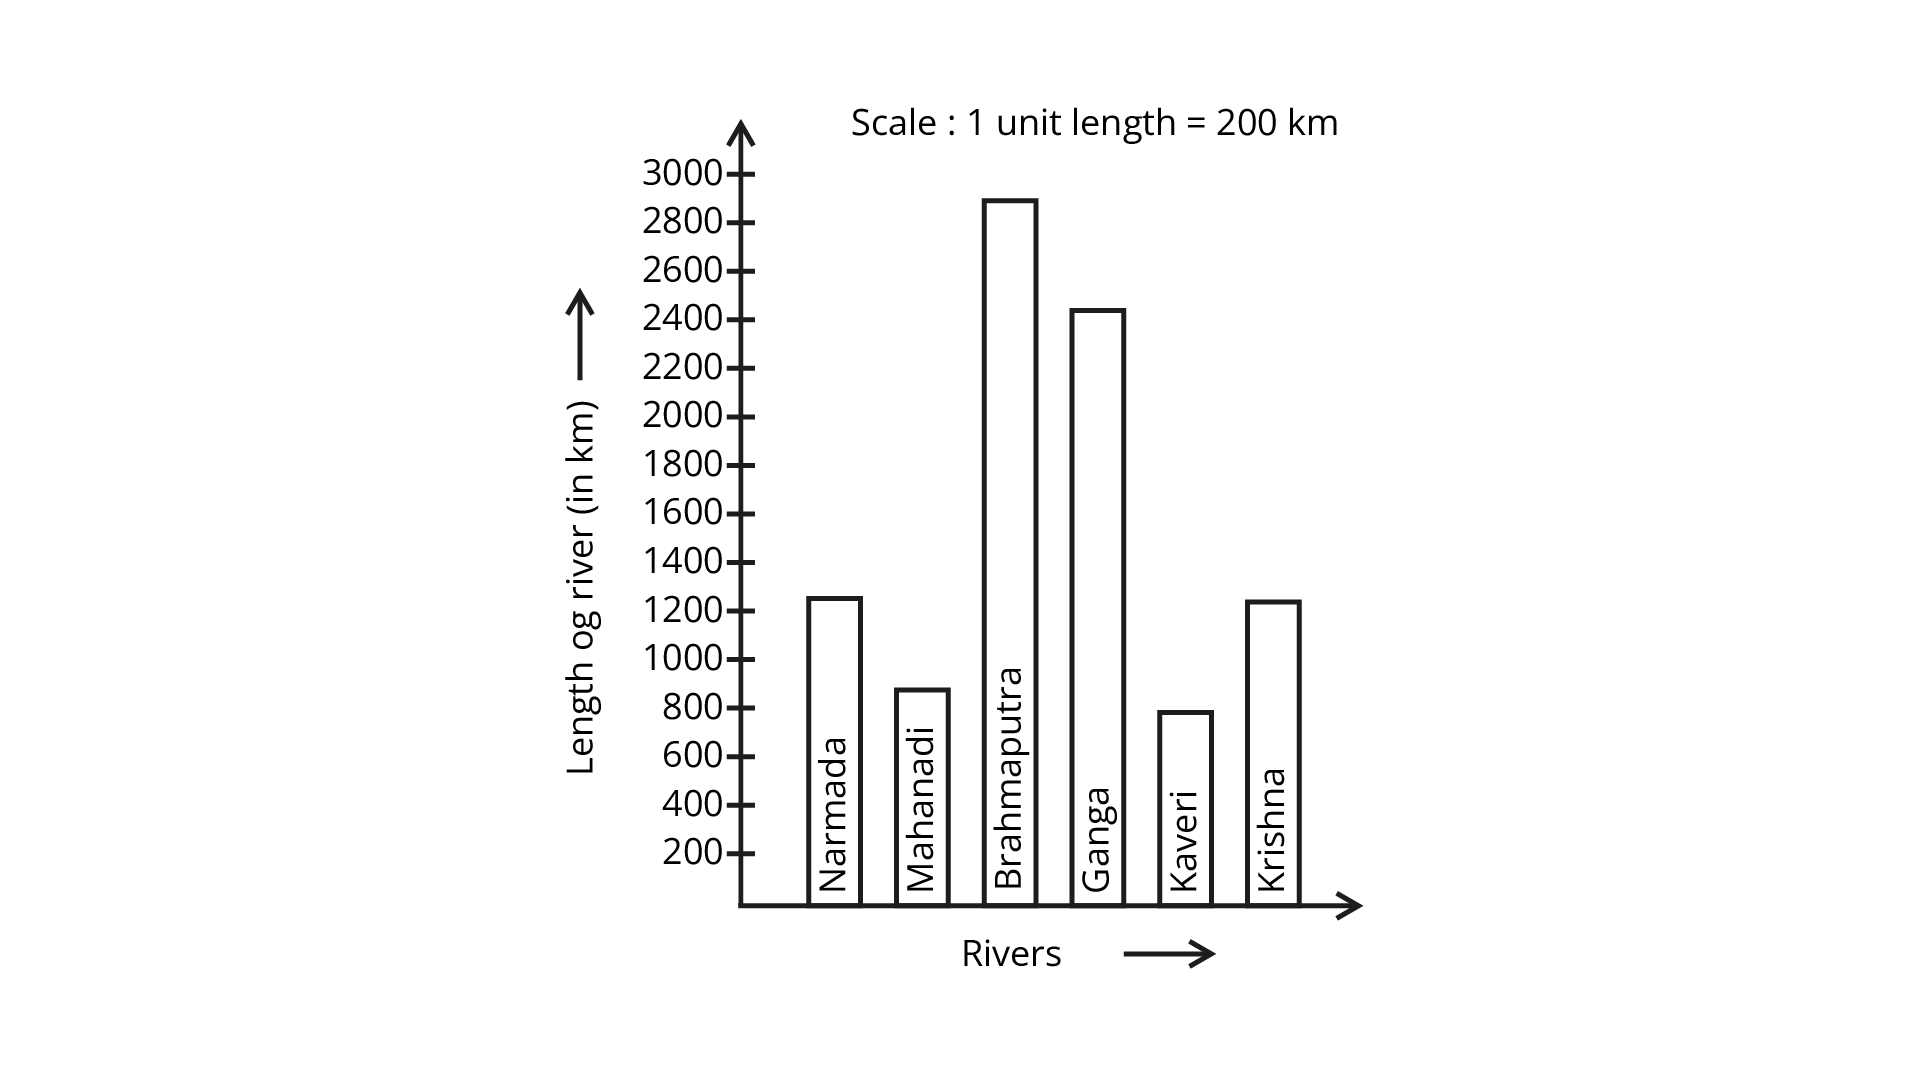
42. The lengths in km (rounded to nearest hundred) of some major rivers of India are given below:
Draw a bar graph to represent the above information.
Ans: To construct a bar graph we take the length of the River on the vertical axis and the name of the River on the horizontal axis.
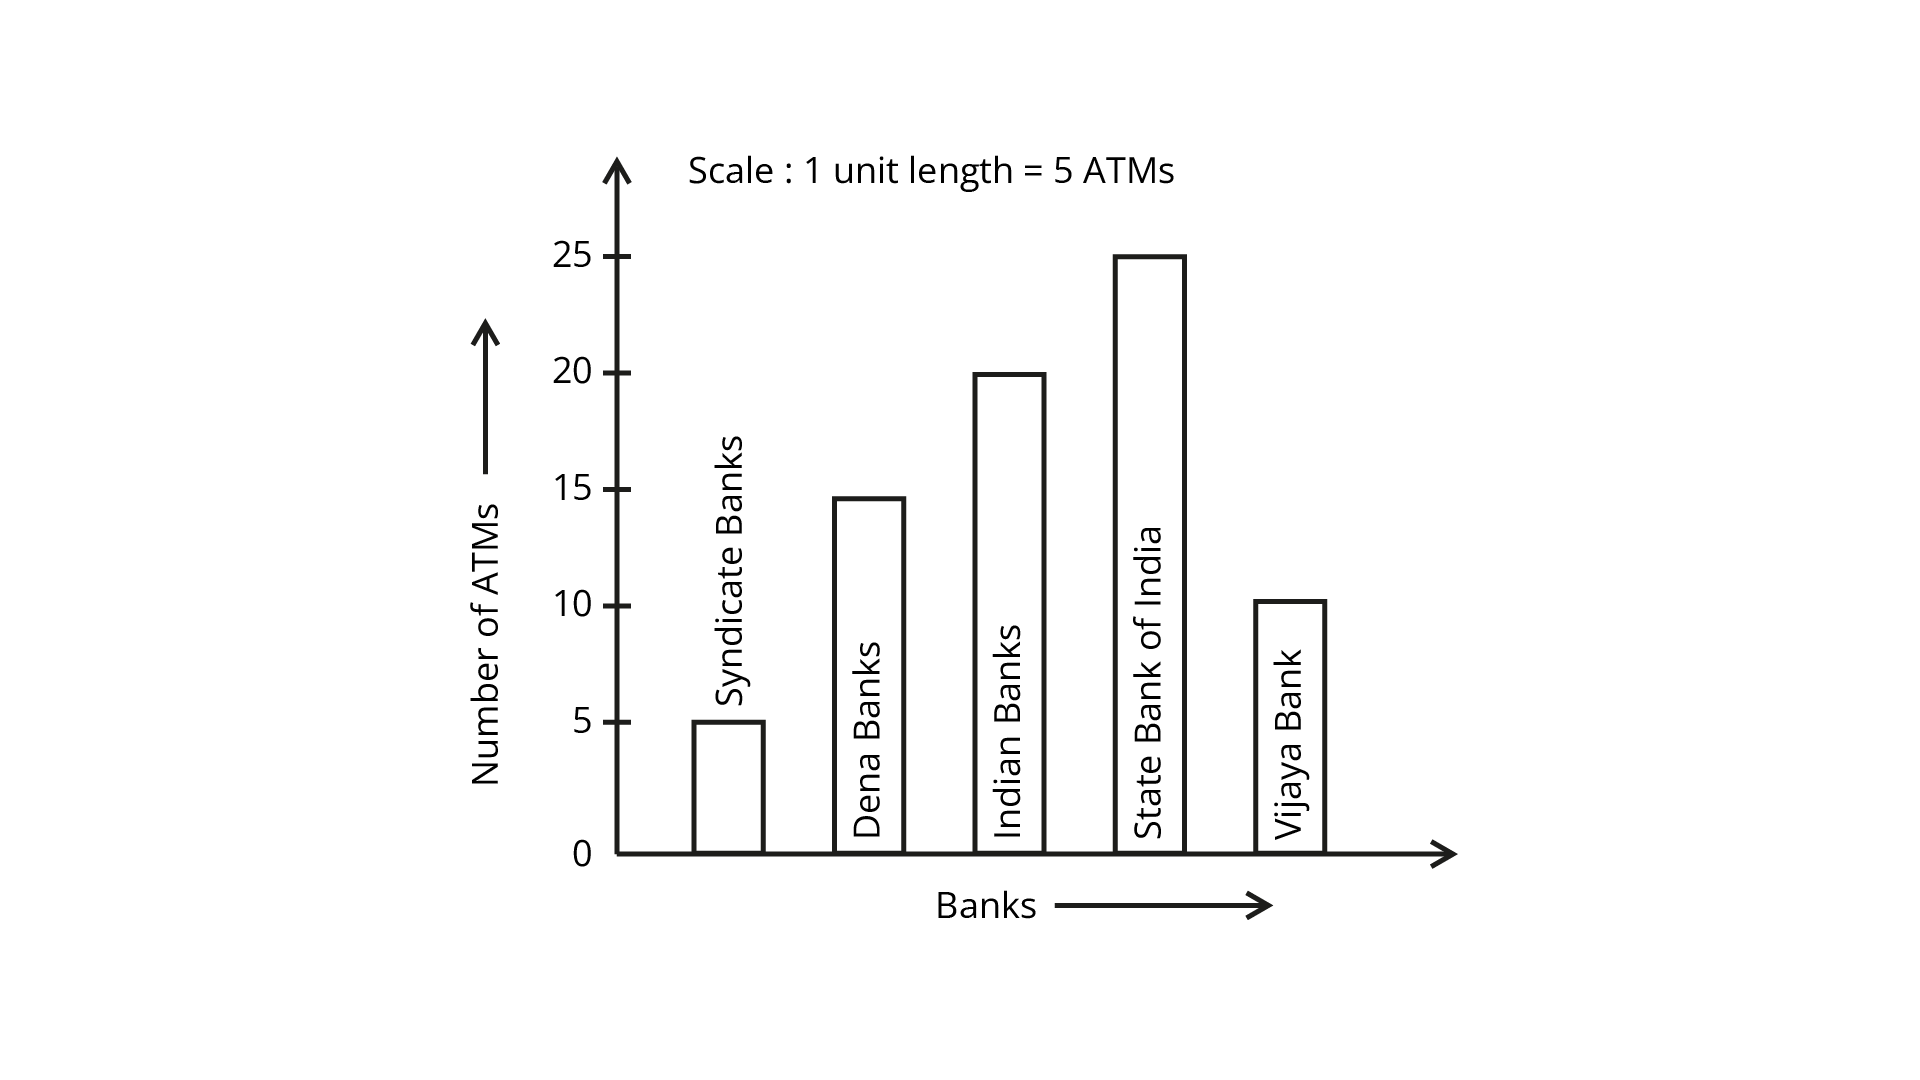
43. The number of ATMs of different banks in a city is shown below:
Draw a bar graph to represent the above information by choosing the scale of your choice.
Ans: To construct a bar graph we take the number of ATM on vertical axis and name of Bank on horizontal axis.
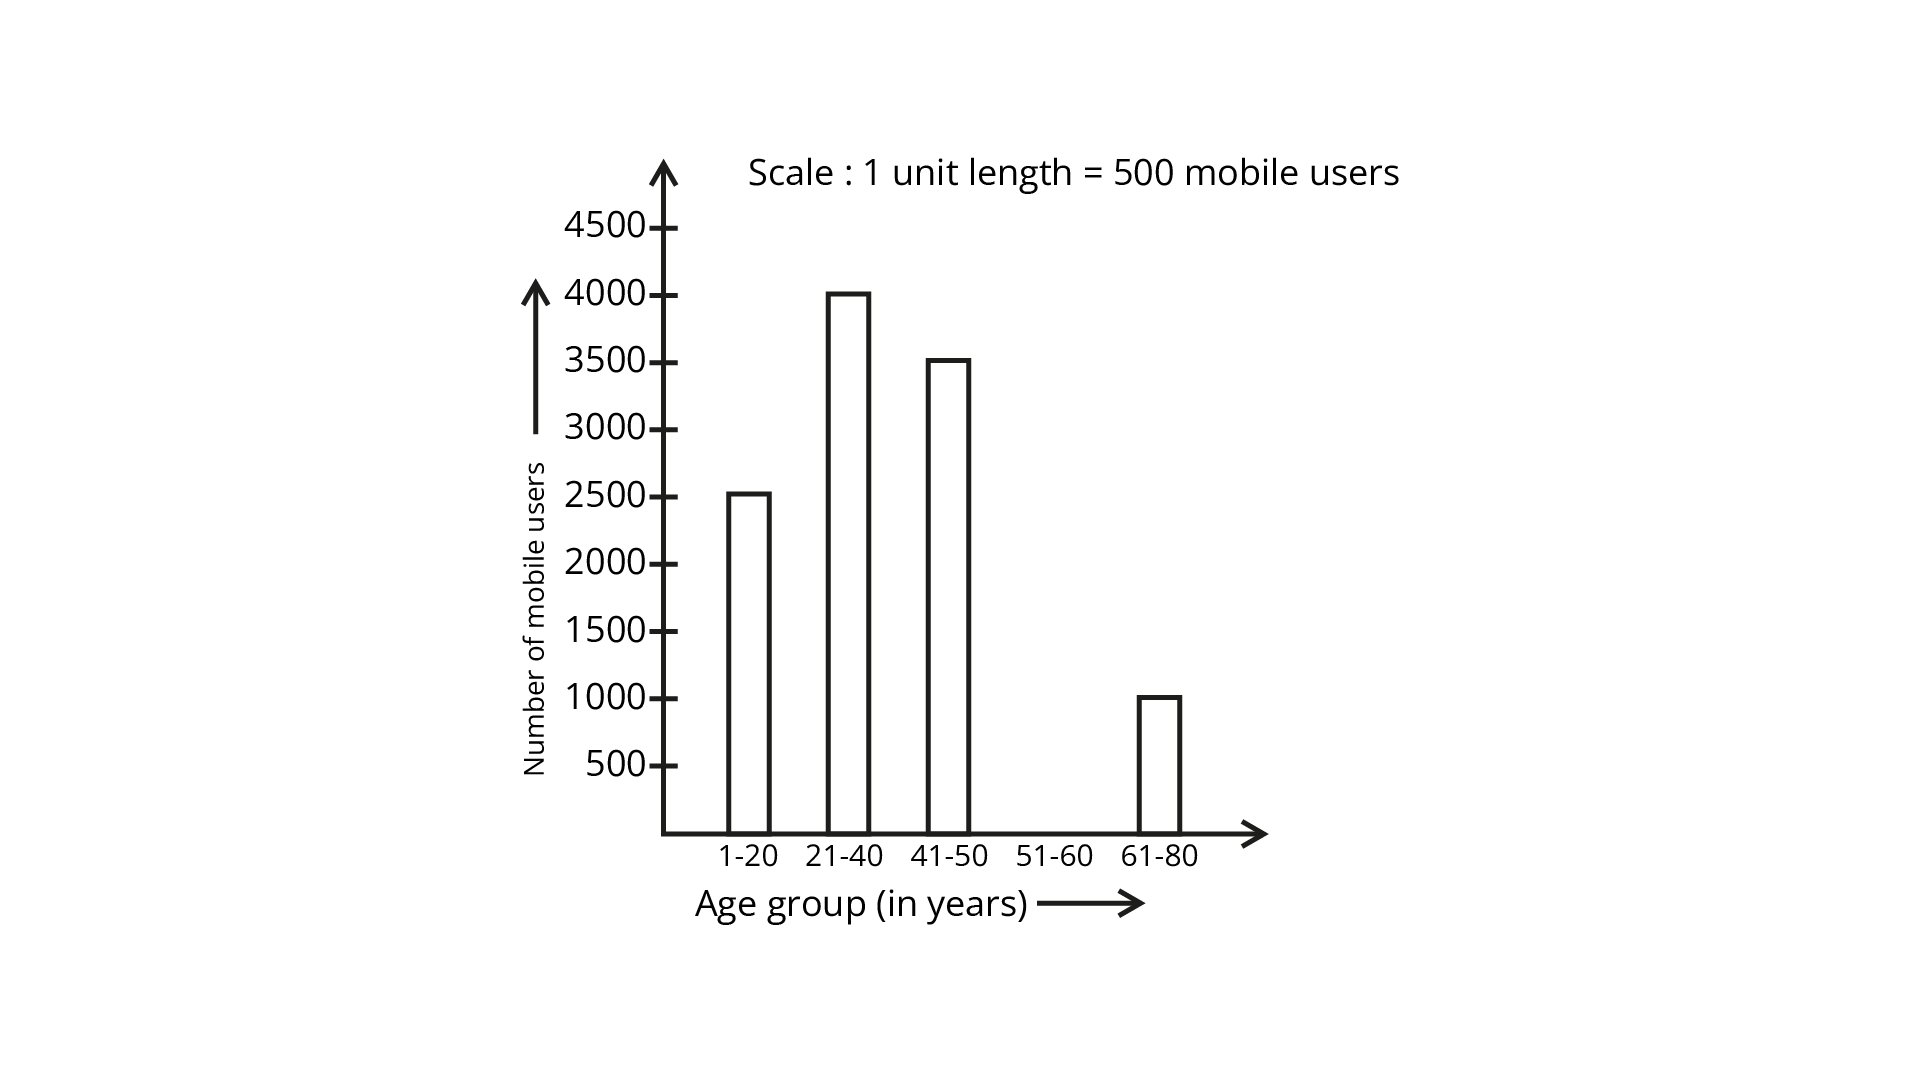
44. Number of mobile phone users in various age groups in a city is listed below:
Draw a bar graph to represent the above information.
Ans: To construct a bar graph we take the number of mobile users on the vertical axis and Age group in the year on the horizontal axis.
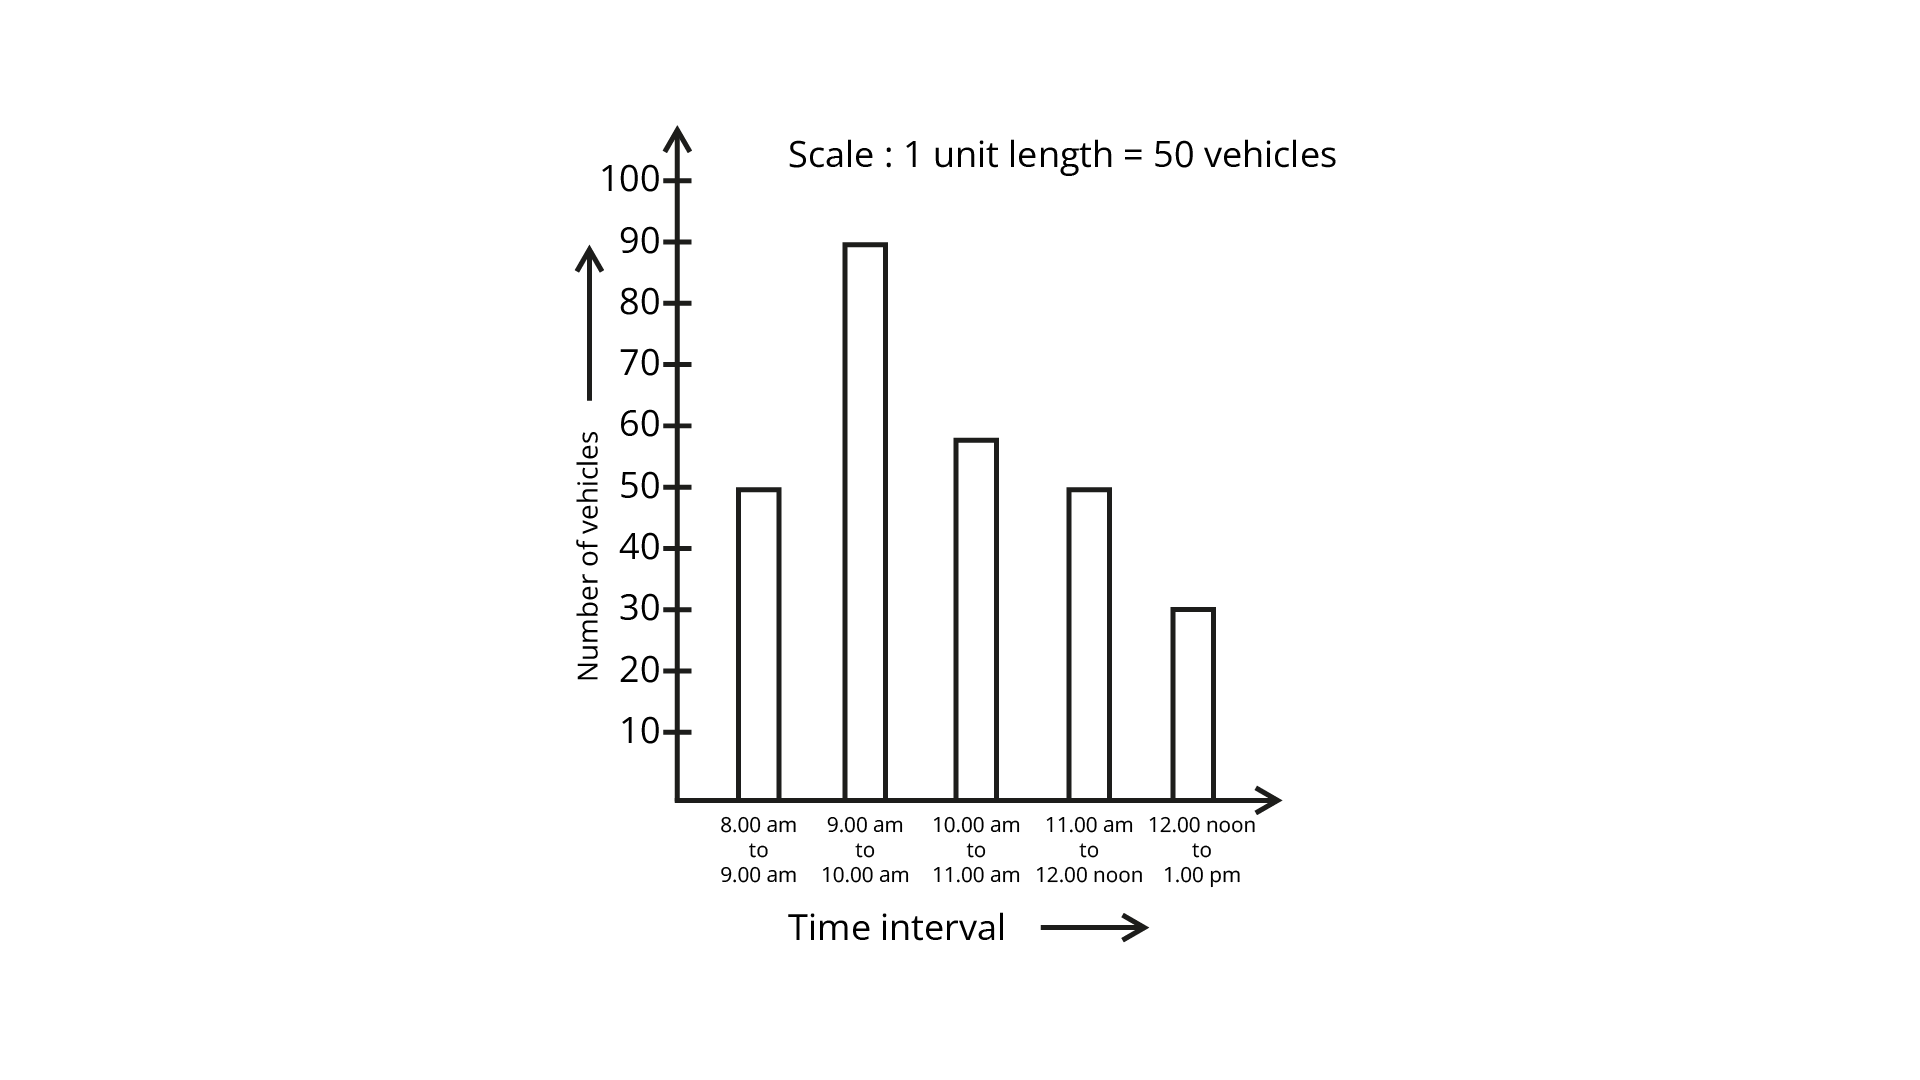
45. The following table gives the number of vehicles passing through a toll gate, every hour from 8.00 am. to 1.00 pm:
Draw a bar graph representing the above data.
Ans: To construct a bar graph we take the number of vehicles on the vertical axis and the Time interval on the horizontal axis.
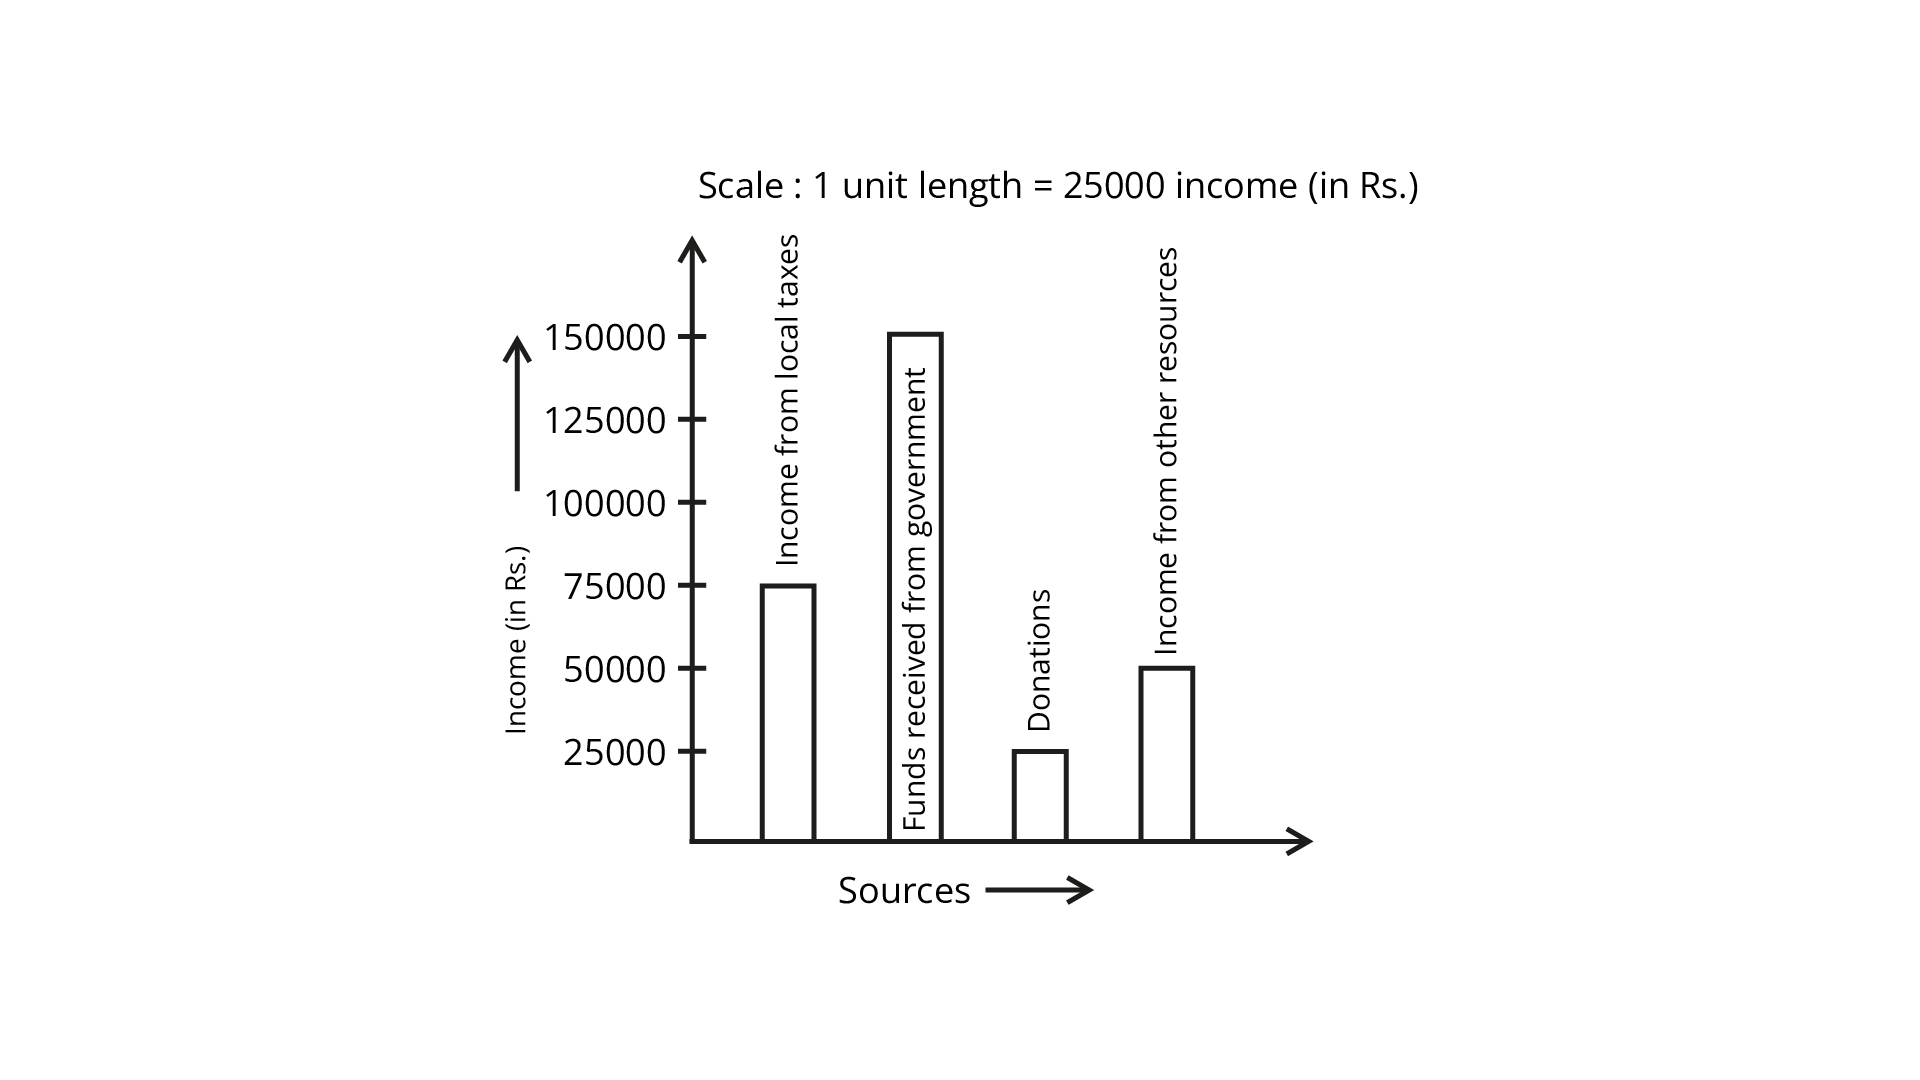
46. The following table represents income of a Gram Panchayat from different sources in a particular year:
Draw a bar graph to represent the above information.
Ans: To construct a bar graph we take the Income on vertical axis and Sources on horizontal axis.
47. The following table gives the data on the number of schools (stage-wise) of a country in the year 2002.
Draw a bar graph to represent the above data.
the Ans: To construct a bar graph we take number of School on vertical axis and Stages on horizontal axis.

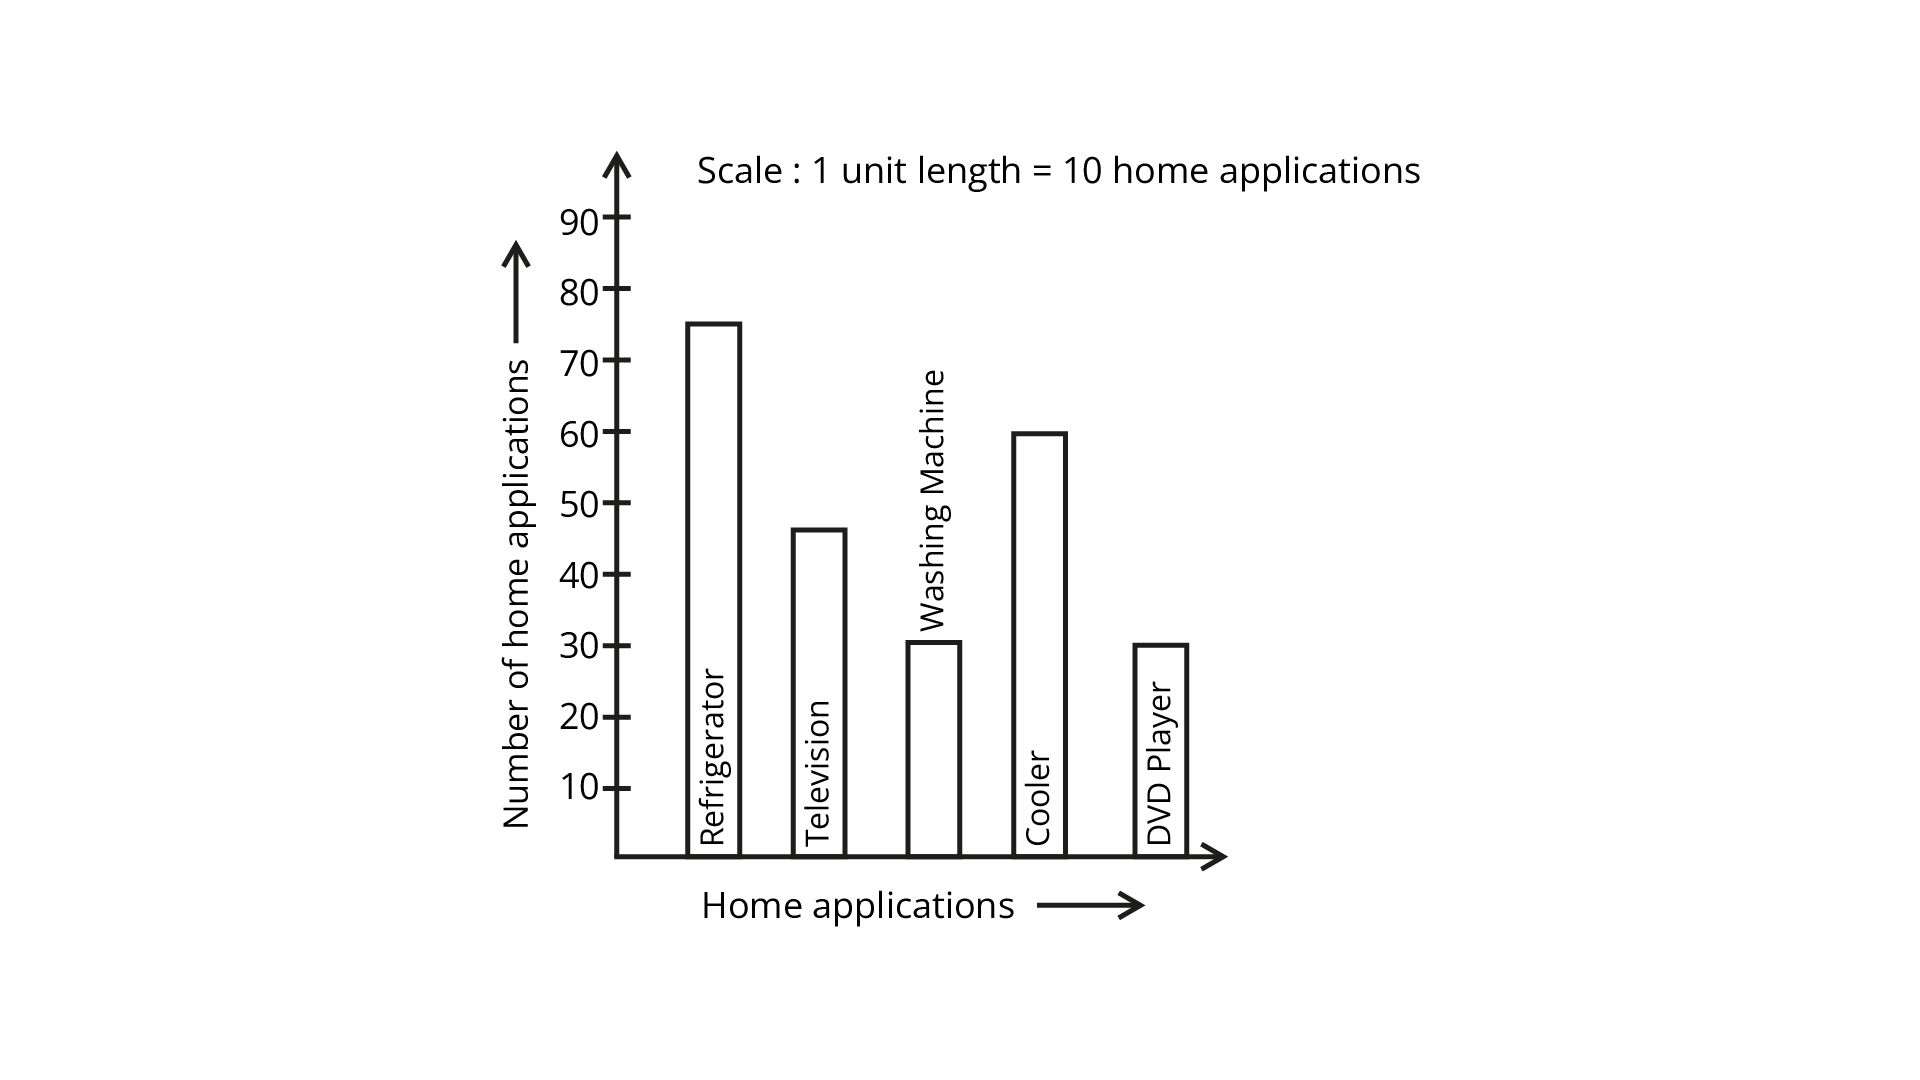
48. Home appliances sold by a shop in one month are given below:
Draw a bar graph to represent the above information.
Ans: To construct a bar graph we take the number of Home appliances on the vertical axis and Home appliances on the horizontal axis.
49. In a botanical garden, the numbers of different types of plants are found as follows:
Draw a bar graph to represent the above information and answer the following questions:
Ans: To construct a bar graph we take the number of Plants on vertical axis and Type of Plant on horizontal axis.
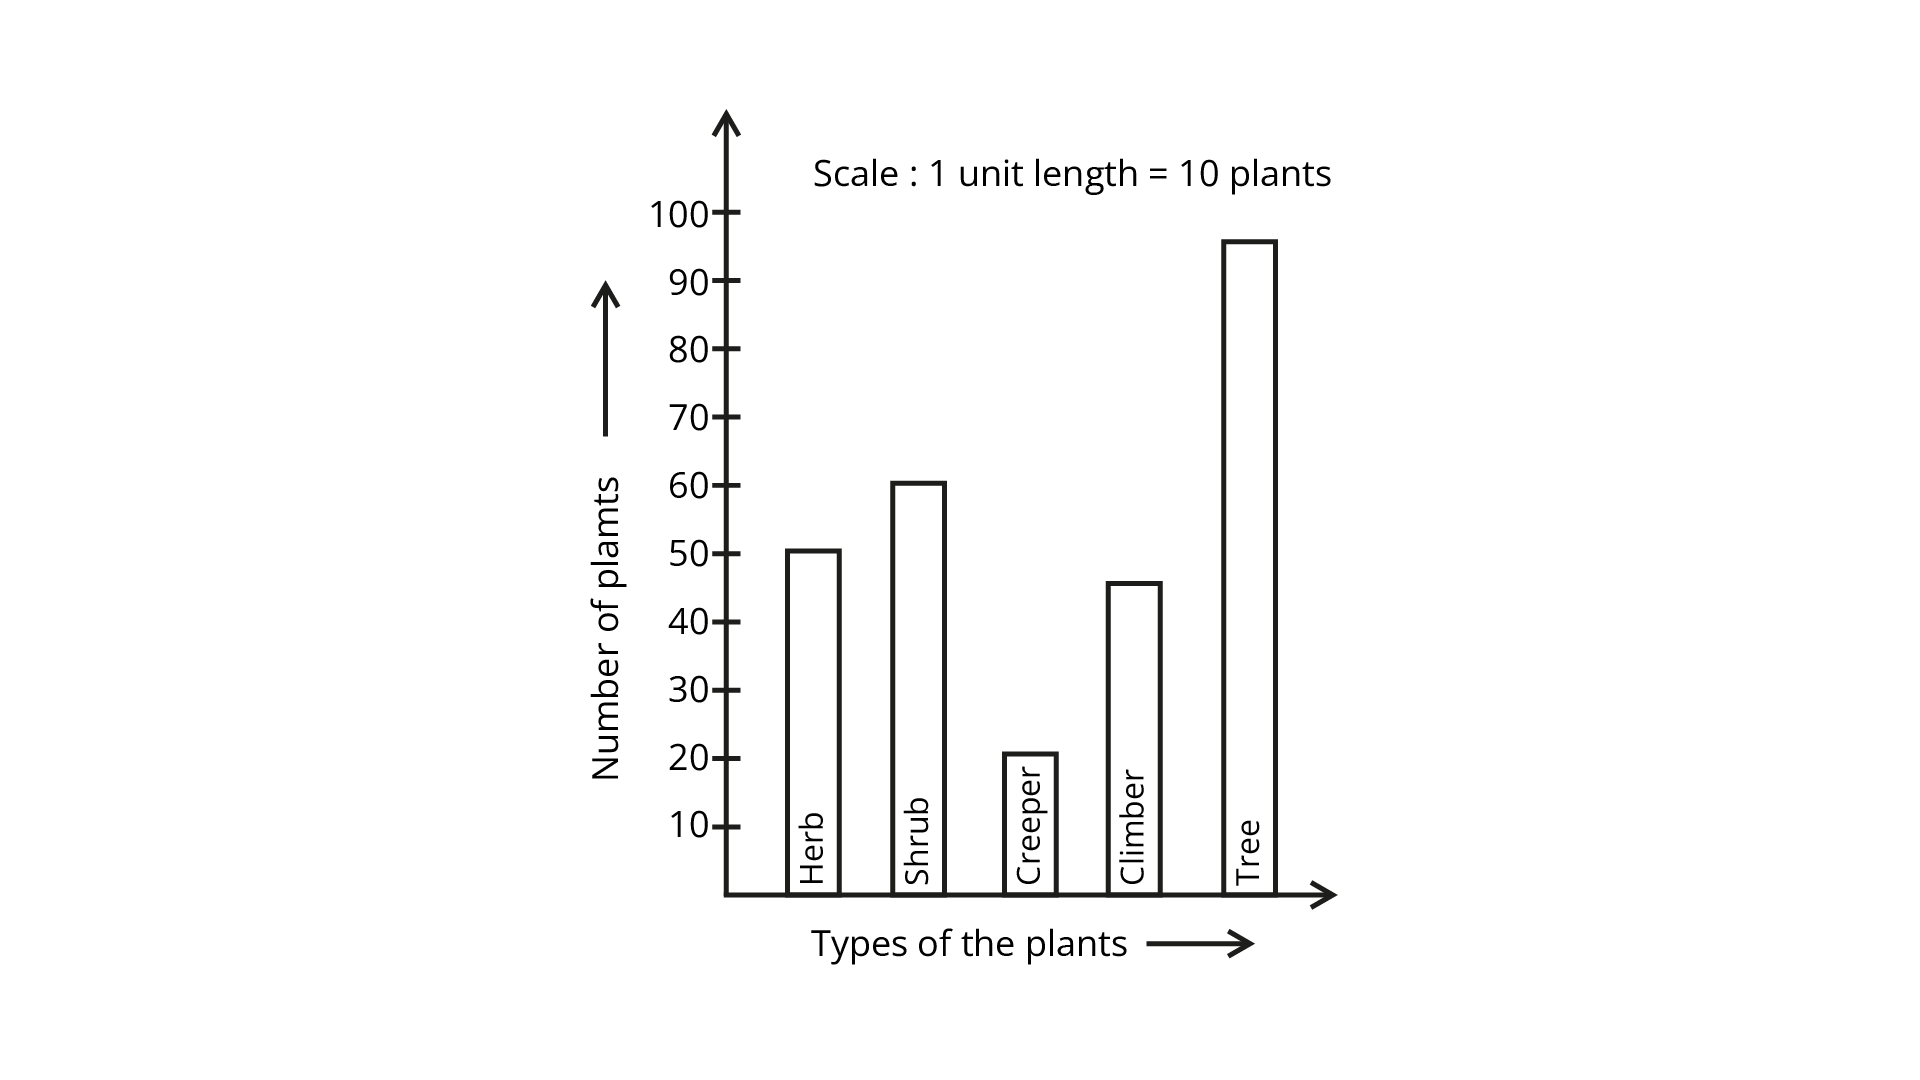
(a) Which type of plant is maximum in number in the garden?
Ans: From the bar graph tree is maximum in number in the garden.
(b) Which type of plant is minimum in number in the garden?
Ans: From the bar graph creeper is minimum in number in the garden.
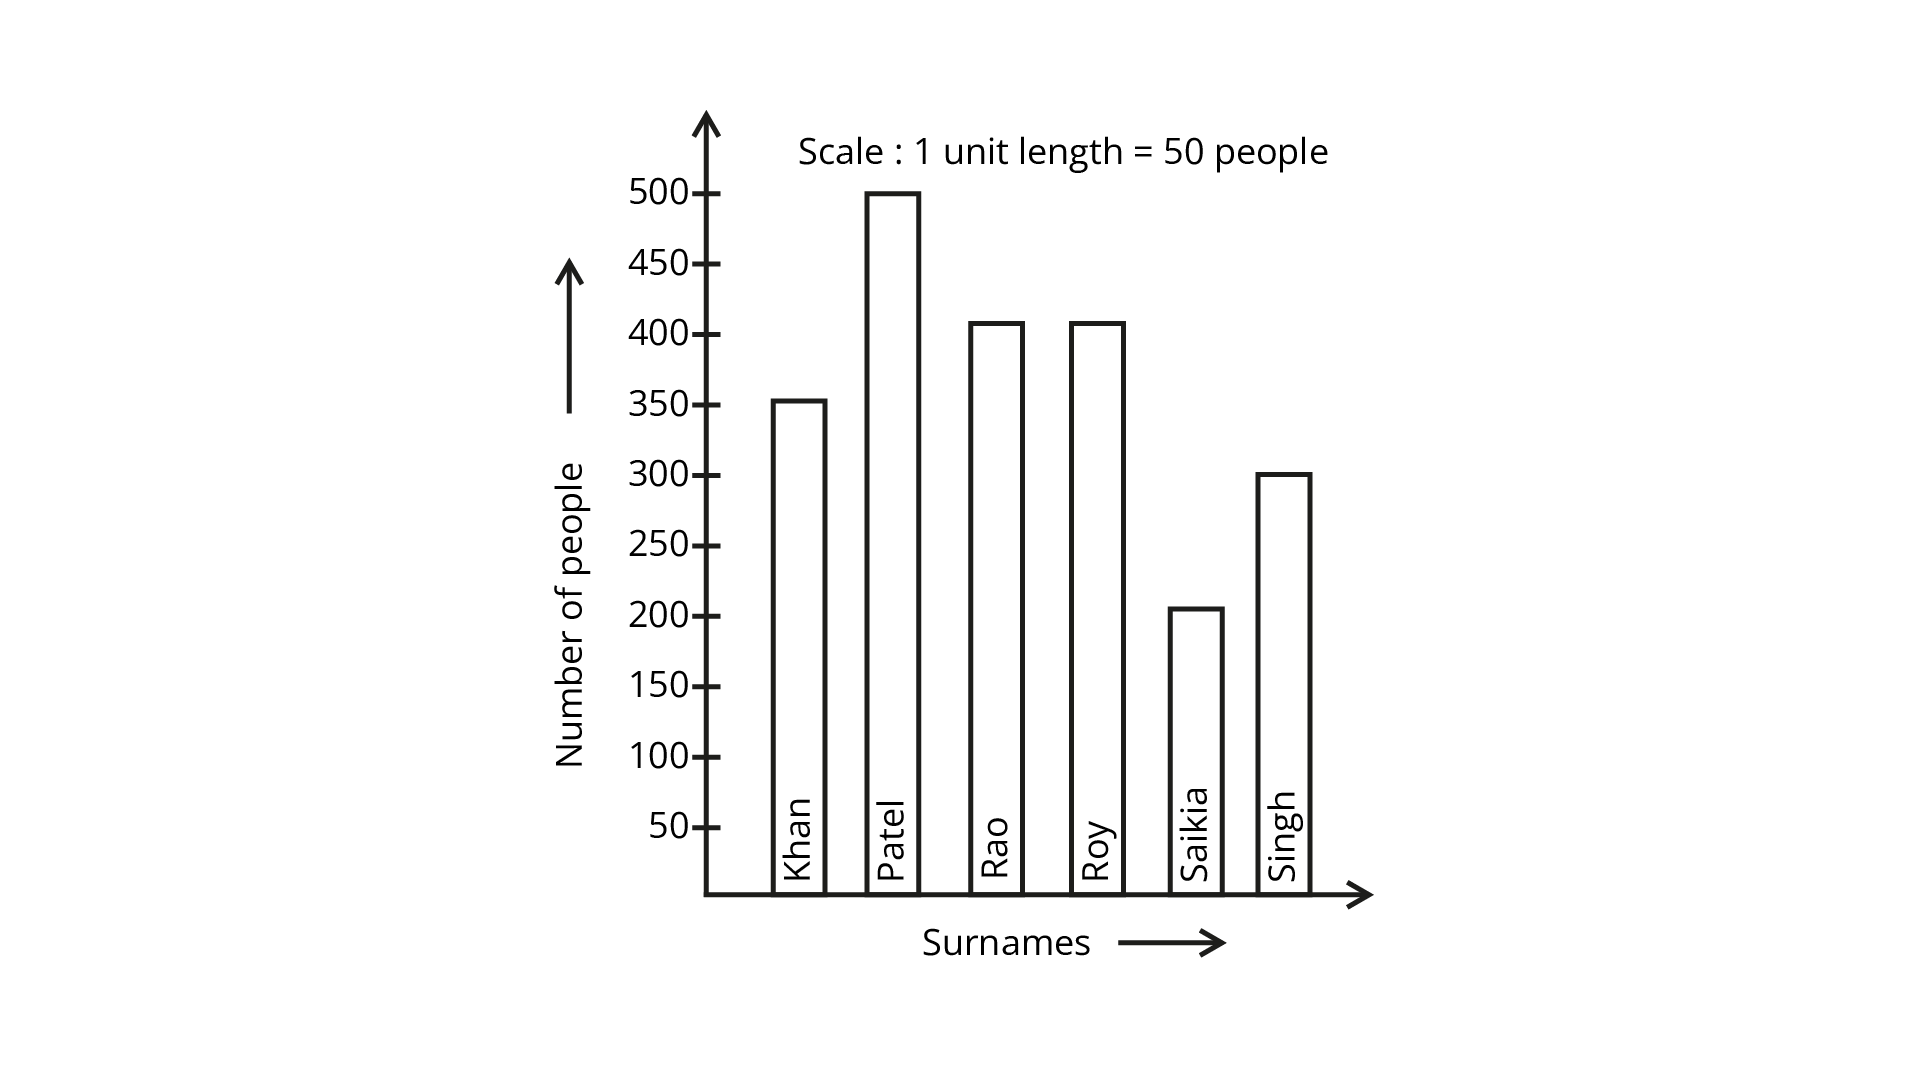
50.Prepare a bar graph of the data given in question 28.
Ans: To construct a bar graph we take the number of People on vertical axis and Surname on horizontal axis.
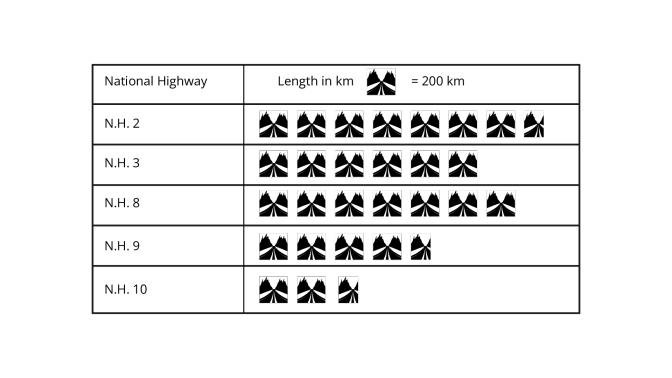
51. Prepare a pictograph of the data by taking a suitable symbol to represent 200 kilometers.
Ans:
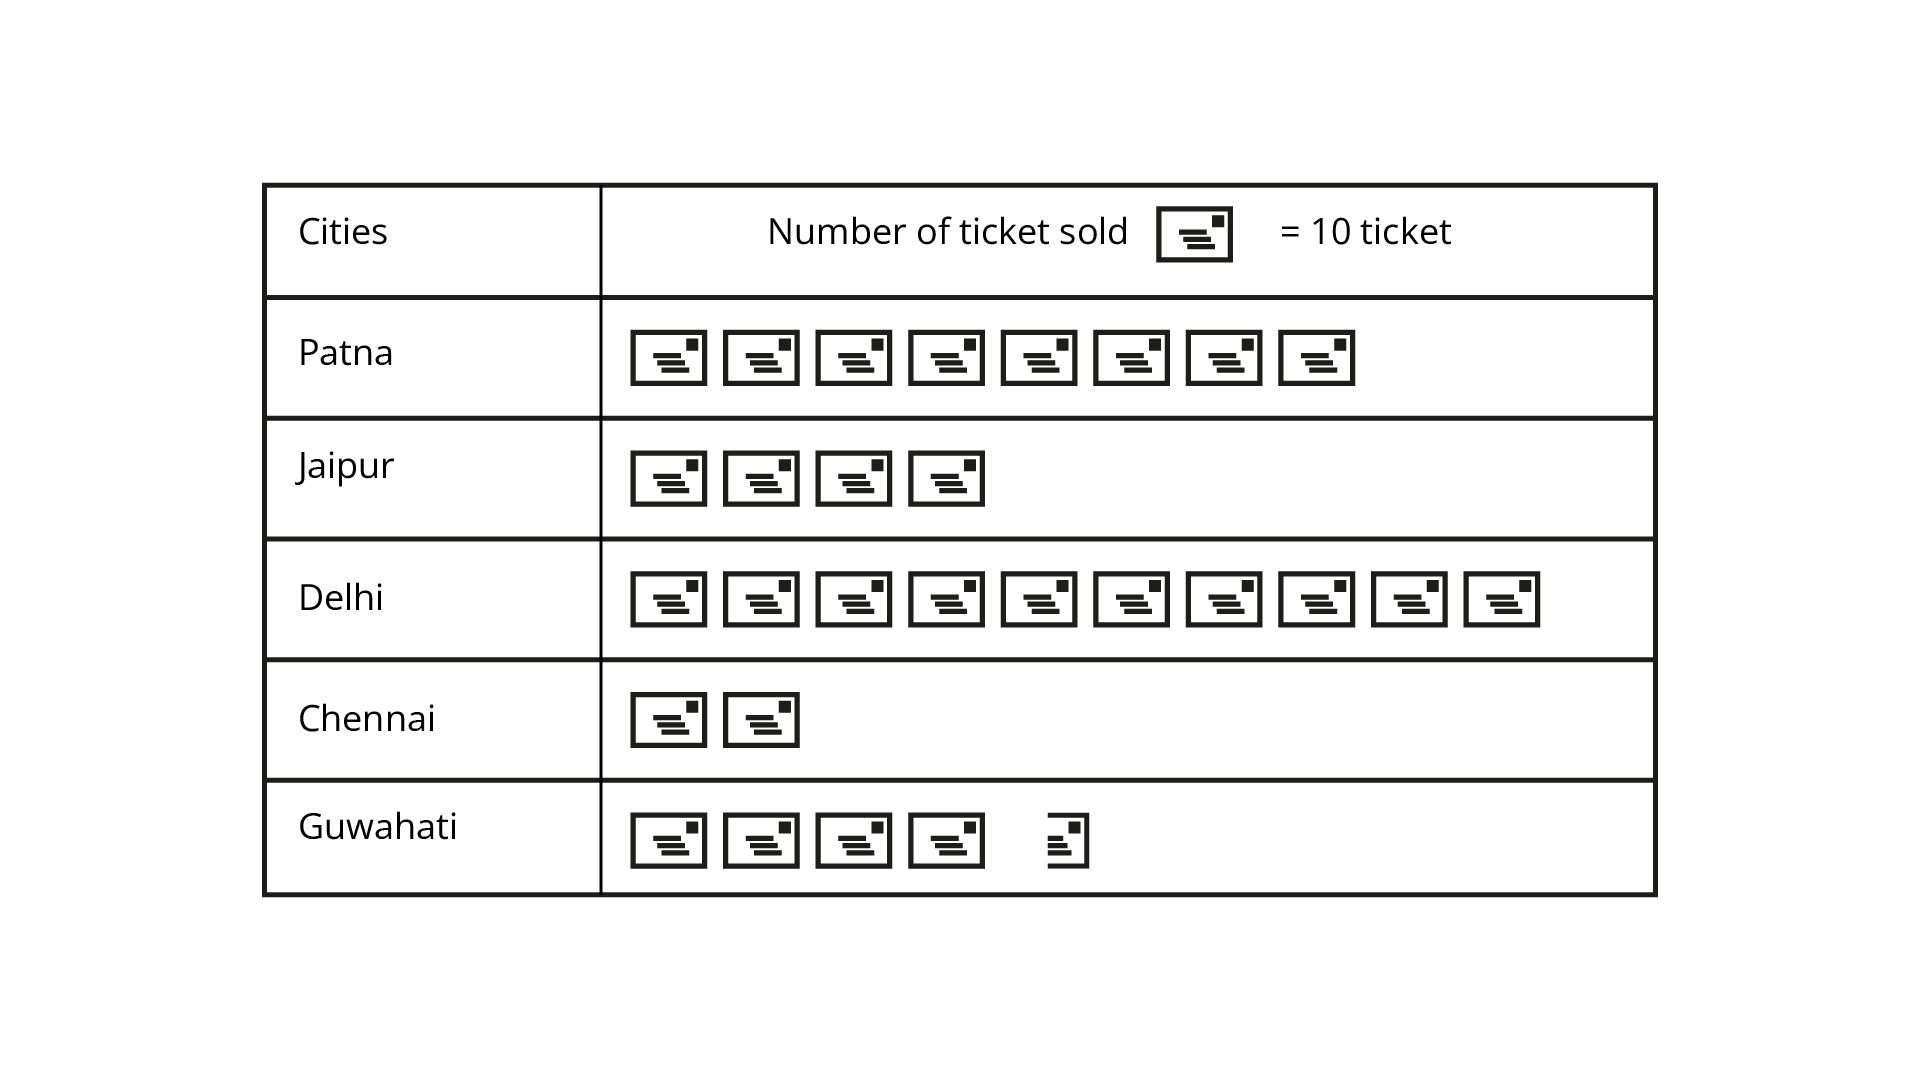
52. Prepare a pictograph of the information given in graph.
Ans:
53.Prepare a bar graph of the data.
Ans: To construct a bar graph we take the number of families on the vertical axis and Number of two wheelers on the horizontal axis.
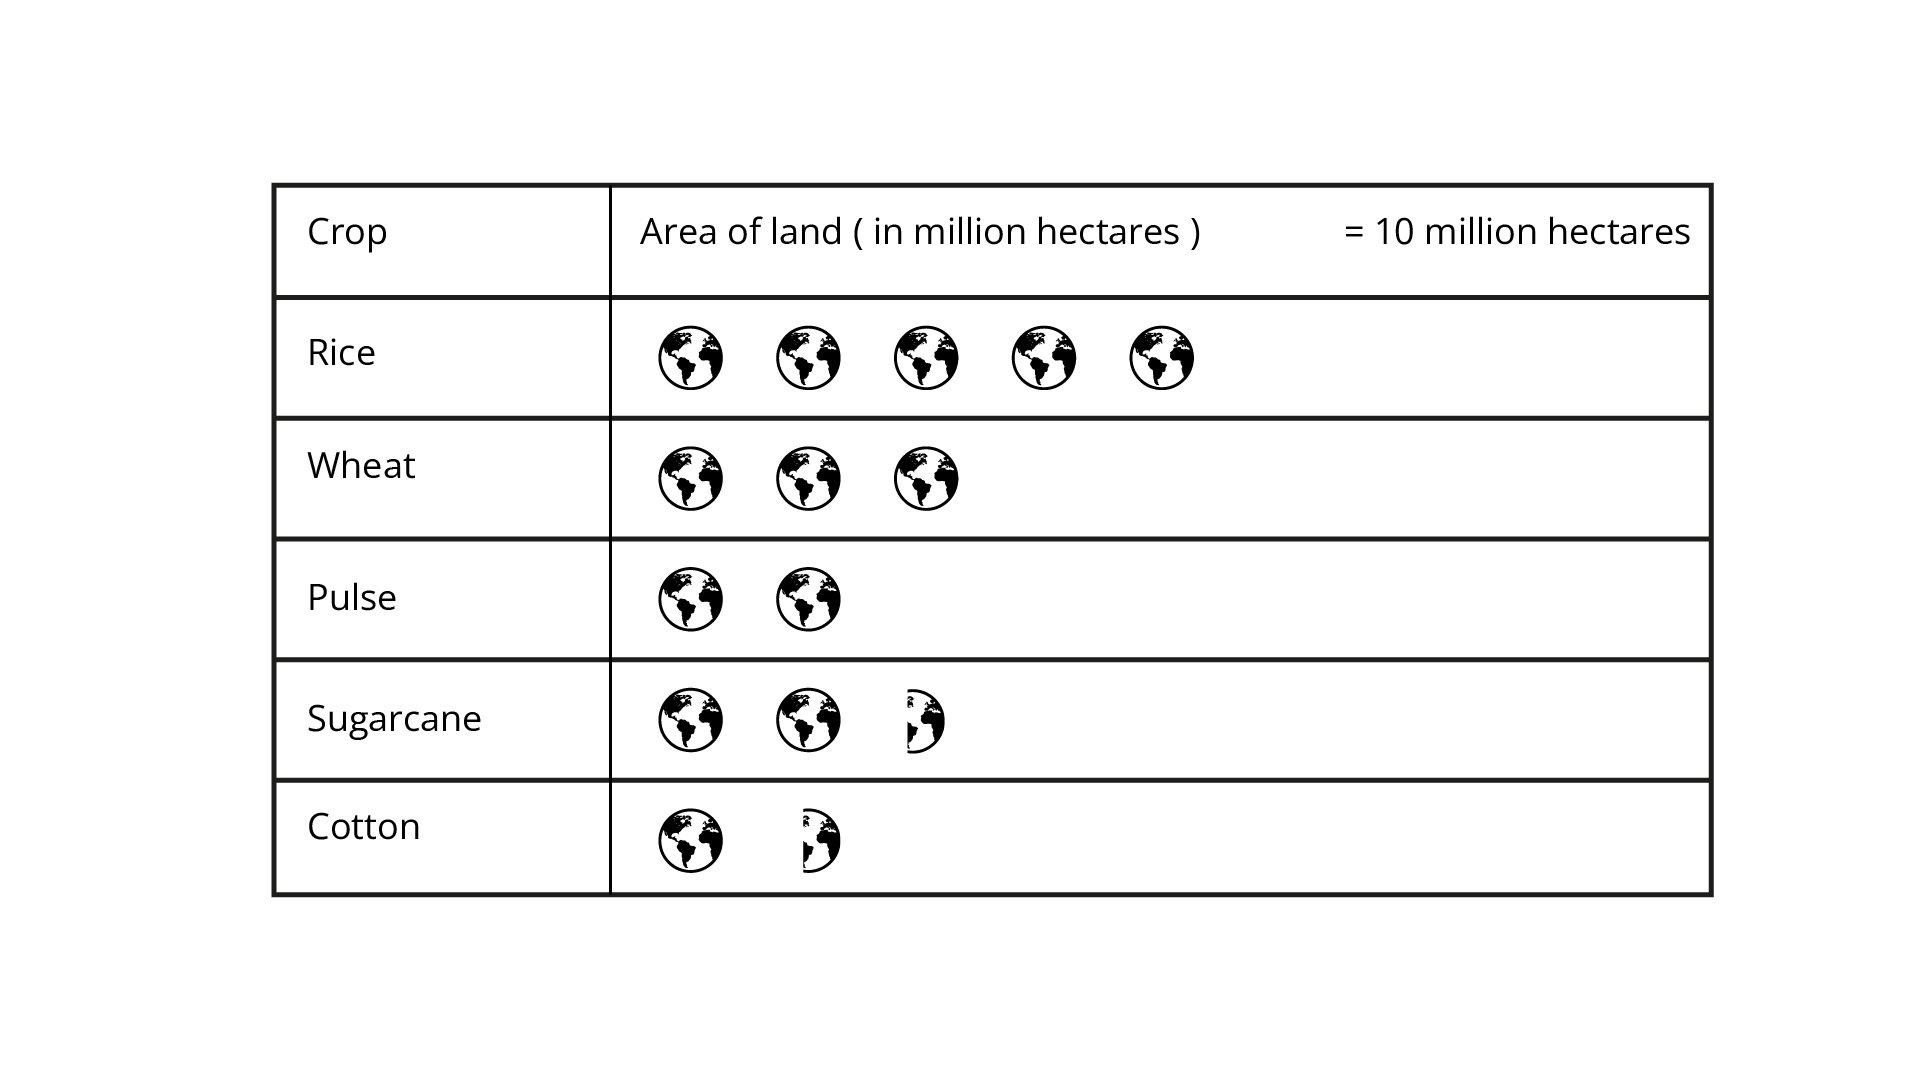
54. The following table shows the area of the land on which different crops were grown.
Prepare a pictograph by choosing a suitable symbol to represent 10 million hectares.
Ans:
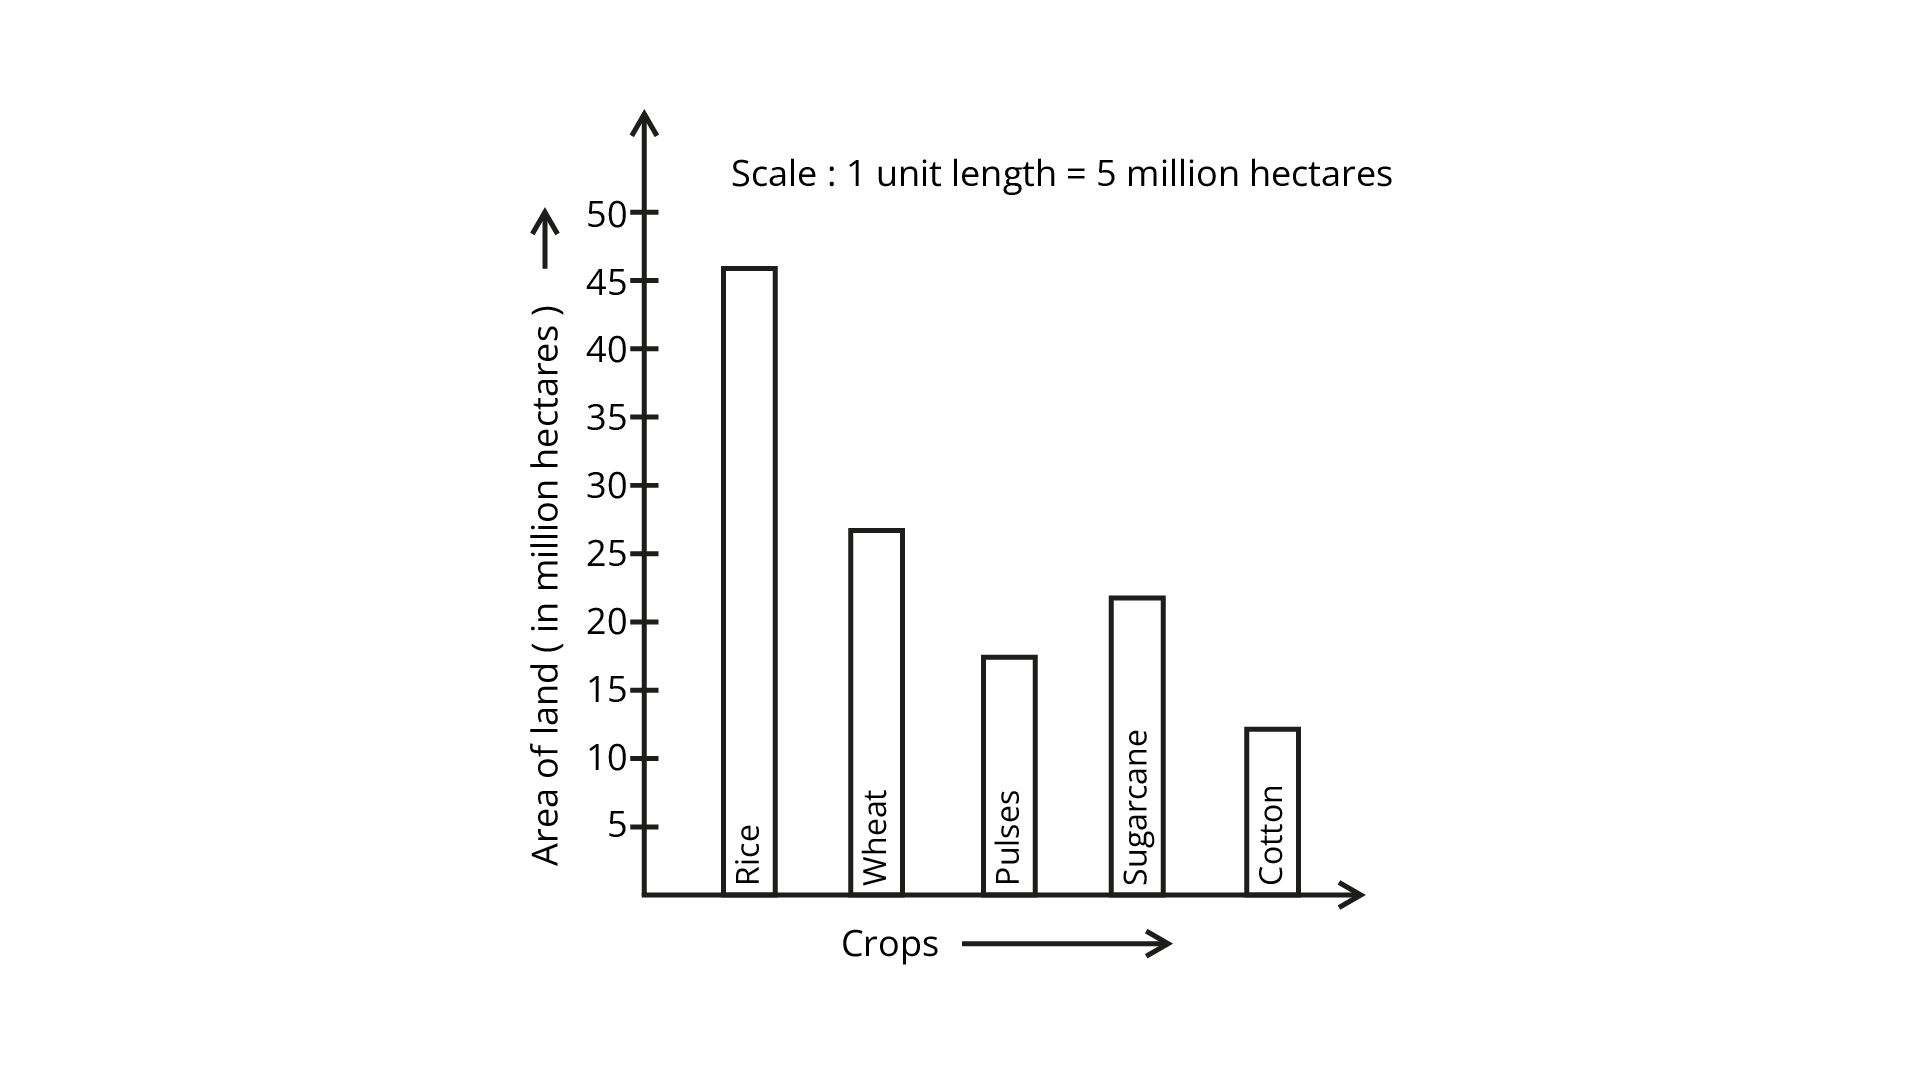
55. Refer to question 54. Prepare a bar graph of the data.
Ans: To construct a bar graph we take the area of land (in million hectares) on the vertical axis and Crops on the horizontal axis.
Data Handling Chapter 5 Class 6 Maths NCERT Exemplar
Data is the collection of numbers gathered to take out some common information or for giving information. When we record data, it becomes easy to convey information in a suitable form.
You must have noticed your teachers take attendance each day and keep data of it in the attendance book. It is nothing but data handling of the students of that particular Class.
Class 6 Data Handling Chapter creates a base to learn complex data in higher Classes. NCERT exemplar provides more questions than ones added in a textbook. These questions are compulsory to solve if you want good marks in your exams.
Download Solutions of NCERT Class 6 Data Handling Exemplar
Download Class 6 Maths Exemplar solutions from Vedantu.com or Install the Vedantu app available on the Google play store. Other subjects exemplar solutions made available on the website, all you need to do, sign in with your email id. Those who don’t have an email id can sign in with their parent’s mobile number.
Students get access to other sources like textbook solutions and one-on-one interaction with the best teachers available on the Vedantu when they join online tuition for Class 6.

FAQs on NCERT Exemplar for Class 6 Maths Solutions Chapter 5 Data Handling
1. What is NCERT Class 6 Exemplar?
NCERT Exemplar is a practice book that consists of additional questions to help students get better in-depth learning of the subject. Class 6 examples contain different questions than ones present in the textbooks. NCERT Exemplar comes without solutions to test students’ calibre.
You can download solutions from our website provided by the best teachers of the Vedantu to help you check your answers and learn from your mistakes. Exemplar assists you do excellent in your examination. Students should solve it after learning each Chapter.
2. Where can I find helpful resources for Class 6 maths?
You can find everything you need for your exam preparation on Vedantu. Experts of the particular subject make these resources and bring them to you to help you learn new concepts more healthily. Resources like important topic notes, formulas, NCERT Exemplars solutions and a lot more everything is for free. Download the Vedanta app or click on the above link to add value-based solutions to your learning. Students can join our online coaching, where you learn from India’s best teachers.
3. Why is it necessary to learn from NCERT Exemplar Class 6 maths?
CBSE board schools follow the NCERT textbooks and other resources. NCERT is a Central autonomous body that makes study material based on the latest syllabus. Teachers follow NCERT to ask questions from the given examples or the examples. These resources help to learn the fundamentals and practice to sharpen your problem-solving ability. Class 6 Maths exemplar has several questions that will enhance your knowledge and prepare your mind for the unfamiliar questions in the exams. Hence, Experts suggest studying the NCERT textbook and examples thoroughly.
4. What is the use of Data Handling Chapter 5 of Class 6?
Each Chapter of Class 6 CBSE helps you learn new concepts and topics that benefit you in higher Classes. It provides a foundation for your career as you move to the upper Class.
You find these Chapters your helping hand in understanding the core of complex problems. Data Handling is one of those Chapters. It teaches you the importance of data and how to use it properly to get meaning from it. In this Class, you learn about the Pictograph, Interpretation of Pictograph, Tally marks and a lot more.
5. How to score well in Class 6 maths?
When students enter secondary Class, they find maths a little complex to understand and fear attempting questions. But as they say, practice makes you better and perfect. To score well in Class 6 maths, you need to solve many questions. NCERT provides some more questions through its example, which helps you grasp things faster. You can join Vedantu online maths tuition for Class 6, where you learn from the best maths experts. To clear all your doubts, the teacher follows animated examples.