


The variation of induced emf(e) in time (t) in a coil if a short bar magnet is moved along its axis with constant velocity is best represented as

Answer
610.5k+ views
Hint: As the magnet is brought closer and closer the magnetic flux getting linked with the coil will keep on increasing. It is given that the magnet travels with a constant velocity. Hence there will be uniform increase in the magnetic flux across the coil. There will be one point wherein the entire flux will get linked with the coil and further will keep on decreasing as the magnet moves away from the coil. Hence we can first calculate the rate at which the flux changes and since the rate of change of flux is given as the induced emf accordingly will generate the graph.
Complete step-by-step answer:
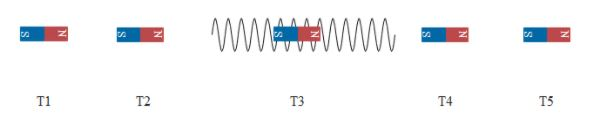
If we see the above diagram the magnet is brought closer to the coil represented by different time intervals. Let the time period between the successive position of magnets be the same . Hence the distance between them will be the same as the magnet moves with constant velocity v. At time T1 let us say the magnet is at position 1and as it moves further the amount of flux of the magnet increases.
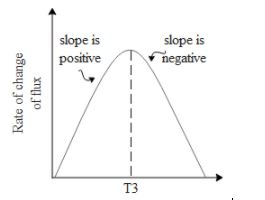
Now let us calculate the rate of the change in flux getting linked to the coil between time interval T1 and T2 and between T2 and T3. If we see the diagram the flux that got linked to the coil between T1 and T2 is less as compared to that between T2 and T3. This is because more field lines get linked to the coil as the magnet is brought closer. There is a maximum linkage of flux at t equals to T3 which implies that the rate of change of flux in small interval time will be maximum at this point. And as it moves away the flux getting linked will go on decreasing resulting in the rate of change to also decrease. Hence we can draw the graph of rate change of flux with respect to time as,
Since the rate of change of flux is the same as emf induced we can draw the diagram of emf v/s time. When the rate of change of flux is positive induced emf is in the opposite direction and when the rate of change of flux is negative emf induced has a different direction. Hence the graph of emf v/s time is
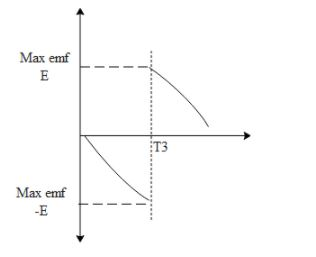
Note: The magnet is moved with uniform velocity. Hence there is a linear increase and decrease in the rate of change of flux. The graph of induced time also shows a linear relationship. One can understand this entire concept by change in flux.
Complete step-by-step answer:
If we see the above diagram the magnet is brought closer to the coil represented by different time intervals. Let the time period between the successive position of magnets be the same . Hence the distance between them will be the same as the magnet moves with constant velocity v. At time T1 let us say the magnet is at position 1and as it moves further the amount of flux of the magnet increases.
Now let us calculate the rate of the change in flux getting linked to the coil between time interval T1 and T2 and between T2 and T3. If we see the diagram the flux that got linked to the coil between T1 and T2 is less as compared to that between T2 and T3. This is because more field lines get linked to the coil as the magnet is brought closer. There is a maximum linkage of flux at t equals to T3 which implies that the rate of change of flux in small interval time will be maximum at this point. And as it moves away the flux getting linked will go on decreasing resulting in the rate of change to also decrease. Hence we can draw the graph of rate change of flux with respect to time as,
Since the rate of change of flux is the same as emf induced we can draw the diagram of emf v/s time. When the rate of change of flux is positive induced emf is in the opposite direction and when the rate of change of flux is negative emf induced has a different direction. Hence the graph of emf v/s time is
Note: The magnet is moved with uniform velocity. Hence there is a linear increase and decrease in the rate of change of flux. The graph of induced time also shows a linear relationship. One can understand this entire concept by change in flux.
Recently Updated Pages
Master Class 12 Social Science: Engaging Questions & Answers for Success
Master Class 12 Physics: Engaging Questions & Answers for Success
Master Class 12 Maths: Engaging Questions & Answers for Success
Master Class 12 Economics: Engaging Questions & Answers for Success
Master Class 12 Chemistry: Engaging Questions & Answers for Success
Master Class 12 Business Studies: Engaging Questions & Answers for Success
Trending doubts
Which are the Top 10 Largest Countries of the World?
Draw a labelled sketch of the human eye class 12 physics CBSE
Explain the structure of megasporangium class 12 biology CBSE
What are the major means of transport Explain each class 12 social science CBSE
How many chromosomes are found in human ovum a 46 b class 12 biology CBSE
The diagram of the section of a maize grain is given class 12 biology CBSE