


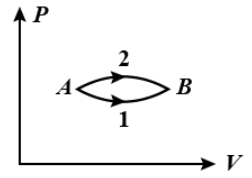
The figure shows two paths for the change of state of gas from A to B. The ratio of molar heat capacities in path 1 and path 2 is
A. < 1
B. > 1
C. 1
D. Data insufficient
Answer
616.5k+ views
Hint: This question can be solved using the formula that relates the internal energy of the gas and the heat capacity of that gas. For the given two paths, we will derive two different equations, and then, we will find the ratio of these equations in terms of the molar heat capacities.
Formula used:
\[Q=nC\Delta T\]
\[\Delta U=n{{C}_{v}}\Delta T\]
\[Q=\Delta U+W\]
Complete step by step answer:
The formula that relates the heat and the heat capacity of an ideal gas is as follows.
\[Q=nC\Delta T\]
Where Q is the heat, n is the number of moles, C is the molar heat capacity (can be a constant pressure or can be at constant volume) and \[\Delta T\]is the change in the temperature.
Express the above equation in terms of the molar heat capacity. So, we get,
\[C=\dfrac{Q}{n\Delta T}\]
As the gas chooses two paths to change the state from A to B, so, the number of moles of the gas and the change in the temperature remains the same for both the processes.
So, the above equation can be rewritten as follows.
\[C\propto Q\]….. (1)
The internal energy is given by the formula,
\[\Delta U=n{{C}_{v}}\Delta T\]
Where n is the number of moles, \[{{C}_{v}}\] is the molar heat capacity at a constant velocity and \[\Delta T\]is the change in the temperature.
\[{{C}_{v}}\]will be a constant value and as the parameters n and \[\Delta T\]remains constant, thus, in turn, the internal energy remains constant.
The work done by the gas is,
\[Q=\Delta U+W\]
The work done will be the area under the curve. So, from the given graph, it’s clear that the work done under the curve for path 2 is more than the work done under the curve for path 1.
\[{{W}_{2}}>{{W}_{1}}\]
As the change in the internal energy is constant, so, we can write,
\[{{Q}_{2}}>{{Q}_{1}}\]
As, from the equation (1), we have, \[C\propto Q\]. So, we get,
\[\begin{align}
& {{C}_{2}}>{{C}_{1}} \\
& \Rightarrow \dfrac{{{C}_{1}}}{{{C}_{2}}}<1 \\
\end{align}\]
As, the ratio of molar heat capacities in path 1 and path 2 is \[<1\].
Thus, the option (A) is correct.
Note:
From the graph, the work done through several paths can be compared by comparing the area under the path curves given. Smaller the curve, smaller will be the amount of work done by the gas and vice – versa.
Recently Updated Pages
Master Class 12 Economics: Engaging Questions & Answers for Success
Master Class 12 English: Engaging Questions & Answers for Success
Master Class 12 Social Science: Engaging Questions & Answers for Success
Master Class 12 Maths: Engaging Questions & Answers for Success
Master Class 12 Physics: Engaging Questions & Answers for Success
Master Class 12 Business Studies: Engaging Questions & Answers for Success
Trending doubts
Which are the Top 10 Largest Countries of the World?
Draw a labelled sketch of the human eye class 12 physics CBSE
Differentiate between homogeneous and heterogeneous class 12 chemistry CBSE
Why is the cell called the structural and functional class 12 biology CBSE
Draw ray diagrams each showing i myopic eye and ii class 12 physics CBSE
Which is the correct genotypic ratio of mendel dihybrid class 12 biology CBSE