


Sweets liked by students of school are given below. Draw pie charts for given data.
Sweets Jalebi Ladoo Peda Gulab jamun Others Number of Students 40% 20% 25% 10% 5%
| Sweets | Jalebi | Ladoo | Peda | Gulab jamun | Others |
| Number of Students | 40% | 20% | 25% | 10% | 5% |
Answer
588.9k+ views
Hint: Here, we are provided by the percentage of students who likes different sweets and pie chart can be easily made by measuring the angle of sectors and plotting them inside a circle whose collective sum is of angle is equals to ${{360}^{{}^\circ }}$.
Complete step-by-step answer:
In question, it is asked to draw a pie chart of data given in table below which show the percentage of students who likes different sweets such as 40% students likes Jalebi, 20% students likes ladoo, 25% students likes peda, 10% students likes gulab jamun and 5% students likes other sweets.
Now, pie chart is a circular pictorial representation on which data is shown by the different size of sectors which collectively makes circle and the sum of angles of all sectors is equals to \[\text{36}{{\text{0}}^{\text{ }\!\!{}^\circ\!\!\text{ }}}\] .
Now, to make a pie chart first step is to find out how much degree a sector is acquiring for each sweet which can be find out by simple formula which is value of activity to the values of all activity put together multiplied by \[\text{36}{{\text{0}}^{\text{ }\!\!{}^\circ\!\!\text{ }}}\] that is \[\dfrac{\text{value of }\!\!%\!\!\text{ of students for particular sweet}}{\text{values of all }\!\!%\!\!\text{ of students put together}}\text{ }\!\!\times\!\!\text{ 36}{{\text{0}}^{\text{ }\!\!{}^\circ\!\!\text{ }}}\] .
Now the total percentage of students equals the sum of all percent of students who like different sweets.
So, Total Hours = 40 + 20 + 25 + 10 + 5 = 24 hours
So, Angle of sector representing percentage of students liking jalebi $=\dfrac{40}{100}\text{ }\!\!\times\!\!\text{ 36}{{\text{0}}^{\text{ }\!\!{}^\circ\!\!\text{ }}}$
On simplifying , Angle of sector representing jalebi $=0.4\text{ }\!\!\times\!\!\text{ 36}{{\text{0}}^{\text{ }\!\!{}^\circ\!\!\text{ }}}={{144}^{{}^\circ }}$
Angle of sector representing percentage of students liking ladoo $=\dfrac{20}{100}\text{ }\!\!\times\!\!\text{ 36}{{\text{0}}^{\text{ }\!\!{}^\circ\!\!\text{ }}}$
On simplifying , Angle of sector representing percentage of students liking ladoo $=\dfrac{1}{5}\text{ }\!\!\times\!\!\text{ 36}{{\text{0}}^{\text{ }\!\!{}^\circ\!\!\text{ }}}={{72}^{{}^\circ }}$
Angle of sector representing percentage of students liking peda $=\dfrac{25}{100}\text{ }\!\!\times\!\!\text{ 36}{{\text{0}}^{\text{ }\!\!{}^\circ\!\!\text{ }}}$
On simplifying , Angle of sector representing percentage of students liking peda $=\dfrac{1}{4}\text{ }\!\!\times\!\!\text{ 36}{{\text{0}}^{\text{ }\!\!{}^\circ\!\!\text{ }}}={{90}^{{}^\circ }}$
Angle of sector representing percentage of students liking gulab jamun $=\dfrac{10}{100}\text{ }\!\!\times\!\!\text{ 36}{{\text{0}}^{\text{ }\!\!{}^\circ\!\!\text{ }}}$
On simplifying , Angle of sector representing others $=\dfrac{1}{10}\text{ }\!\!\times\!\!\text{ 36}{{\text{0}}^{\text{ }\!\!{}^\circ\!\!\text{ }}}={{36}^{{}^\circ }}$
Angle of sector representing percentage of students liking other sweet $=\dfrac{5}{100}\text{ }\!\!\times\!\!\text{ 36}{{\text{0}}^{\text{ }\!\!{}^\circ\!\!\text{ }}}$
On simplifying , Angle of sector representing others $=\dfrac{1}{20}\text{ }\!\!\times\!\!\text{ 36}{{\text{0}}^{\text{ }\!\!{}^\circ\!\!\text{ }}}={{18}^{{}^\circ }}$
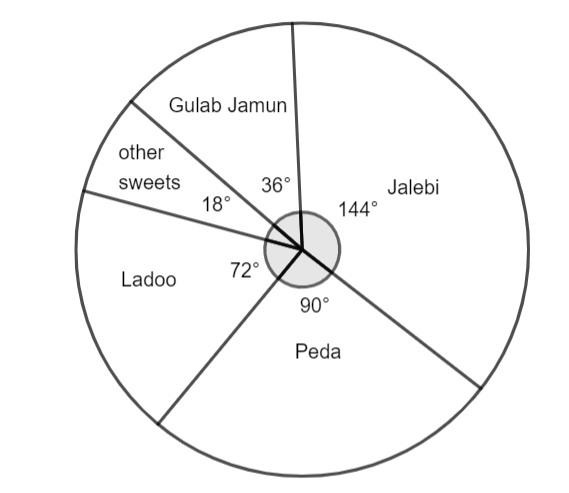
So, pie chart representing the table data will be of form,
Note: Total percentage of students who like different sweets should be measured properly as it will change the value of measure and hence pie charts will be formed wrong. Pie charts should be neat and visible and should be properly labelled. Try not to make any calculation mistakes.
Complete step-by-step answer:
In question, it is asked to draw a pie chart of data given in table below which show the percentage of students who likes different sweets such as 40% students likes Jalebi, 20% students likes ladoo, 25% students likes peda, 10% students likes gulab jamun and 5% students likes other sweets.
Now, pie chart is a circular pictorial representation on which data is shown by the different size of sectors which collectively makes circle and the sum of angles of all sectors is equals to \[\text{36}{{\text{0}}^{\text{ }\!\!{}^\circ\!\!\text{ }}}\] .
Now, to make a pie chart first step is to find out how much degree a sector is acquiring for each sweet which can be find out by simple formula which is value of activity to the values of all activity put together multiplied by \[\text{36}{{\text{0}}^{\text{ }\!\!{}^\circ\!\!\text{ }}}\] that is \[\dfrac{\text{value of }\!\!%\!\!\text{ of students for particular sweet}}{\text{values of all }\!\!%\!\!\text{ of students put together}}\text{ }\!\!\times\!\!\text{ 36}{{\text{0}}^{\text{ }\!\!{}^\circ\!\!\text{ }}}\] .
Now the total percentage of students equals the sum of all percent of students who like different sweets.
So, Total Hours = 40 + 20 + 25 + 10 + 5 = 24 hours
So, Angle of sector representing percentage of students liking jalebi $=\dfrac{40}{100}\text{ }\!\!\times\!\!\text{ 36}{{\text{0}}^{\text{ }\!\!{}^\circ\!\!\text{ }}}$
On simplifying , Angle of sector representing jalebi $=0.4\text{ }\!\!\times\!\!\text{ 36}{{\text{0}}^{\text{ }\!\!{}^\circ\!\!\text{ }}}={{144}^{{}^\circ }}$
Angle of sector representing percentage of students liking ladoo $=\dfrac{20}{100}\text{ }\!\!\times\!\!\text{ 36}{{\text{0}}^{\text{ }\!\!{}^\circ\!\!\text{ }}}$
On simplifying , Angle of sector representing percentage of students liking ladoo $=\dfrac{1}{5}\text{ }\!\!\times\!\!\text{ 36}{{\text{0}}^{\text{ }\!\!{}^\circ\!\!\text{ }}}={{72}^{{}^\circ }}$
Angle of sector representing percentage of students liking peda $=\dfrac{25}{100}\text{ }\!\!\times\!\!\text{ 36}{{\text{0}}^{\text{ }\!\!{}^\circ\!\!\text{ }}}$
On simplifying , Angle of sector representing percentage of students liking peda $=\dfrac{1}{4}\text{ }\!\!\times\!\!\text{ 36}{{\text{0}}^{\text{ }\!\!{}^\circ\!\!\text{ }}}={{90}^{{}^\circ }}$
Angle of sector representing percentage of students liking gulab jamun $=\dfrac{10}{100}\text{ }\!\!\times\!\!\text{ 36}{{\text{0}}^{\text{ }\!\!{}^\circ\!\!\text{ }}}$
On simplifying , Angle of sector representing others $=\dfrac{1}{10}\text{ }\!\!\times\!\!\text{ 36}{{\text{0}}^{\text{ }\!\!{}^\circ\!\!\text{ }}}={{36}^{{}^\circ }}$
Angle of sector representing percentage of students liking other sweet $=\dfrac{5}{100}\text{ }\!\!\times\!\!\text{ 36}{{\text{0}}^{\text{ }\!\!{}^\circ\!\!\text{ }}}$
On simplifying , Angle of sector representing others $=\dfrac{1}{20}\text{ }\!\!\times\!\!\text{ 36}{{\text{0}}^{\text{ }\!\!{}^\circ\!\!\text{ }}}={{18}^{{}^\circ }}$
So, pie chart representing the table data will be of form,
Note: Total percentage of students who like different sweets should be measured properly as it will change the value of measure and hence pie charts will be formed wrong. Pie charts should be neat and visible and should be properly labelled. Try not to make any calculation mistakes.
Recently Updated Pages
Master Class 9 General Knowledge: Engaging Questions & Answers for Success
Master Class 9 Social Science: Engaging Questions & Answers for Success
Master Class 9 English: Engaging Questions & Answers for Success
Master Class 9 Maths: Engaging Questions & Answers for Success
Master Class 9 Science: Engaging Questions & Answers for Success
Class 9 Question and Answer - Your Ultimate Solutions Guide
Trending doubts
Which are the Top 10 Largest Countries of the World?
What is BLO What is the full form of BLO class 8 social science CBSE
The value of 6 more than 7 is A 1 B 1 C 13 D 13 class 7 maths CBSE
One Metric ton is equal to kg A 10000 B 1000 C 100 class 11 physics CBSE
There are 720 permutations of the digits 1 2 3 4 5 class 11 maths CBSE
Difference Between Plant Cell and Animal Cell