


Study the double bar graph shown below and answers the question that follow:
a). What information is represented by the above double bar graph?
b). In which month sales of Brand \[A\]decreased as compared to the previous month?
c). What is the difference in sales of both the Brands for the month of June?
d). Find the average sales of Brand \[B\] for the six months.
e). List all months for which the sale of Brand \[B\] was less than that of Brand \[A\].
f). Find the ratio of sales of Brand \[A\] as compared to Brand \[B\] for the month of January.
Answer
507.3k+ views
Hint: To get the answer of all the parts of this question firstly we should know how to read the double bar graphs. Double bar graphs are used to compare two quantities that are the sales of the Brand \[A\] and Brand \[B\]. Answer each part by simply reading the corresponding values in the graph.
Complete step-by-step solution:
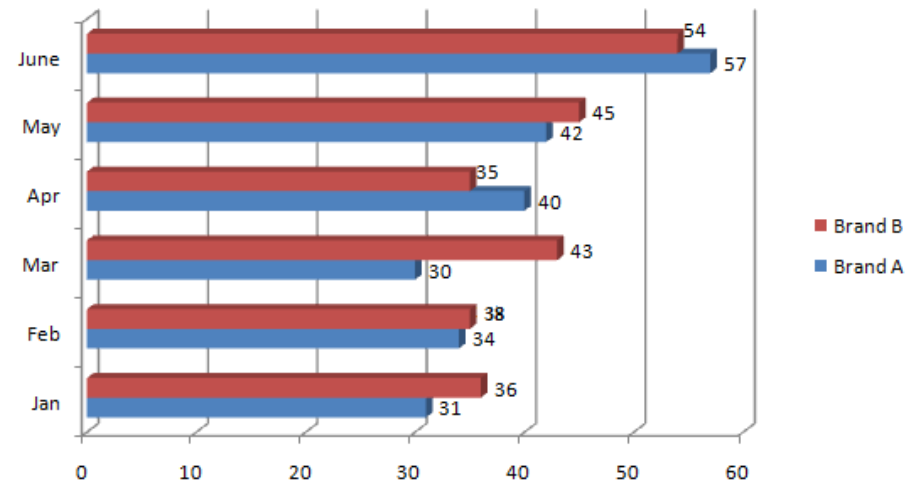
a). In This question the double graph is used to compare the sales of two brands and the two brands are Brand \[A\] and Brand \[B\].
b). To get the answer to this part we have to compare the sales of Brand \[A\] with the sale of Brand \[A\] from the previous month. So if we see, the sales in the month of January is \[31\] and in the month of February is \[34\]. Sales is increasing so we will similarly check for the next month as we know in February sales is \[34\]and in the month of March sales is \[30\]. This means that sales are decreasing from the previous month. So the answer is March.
c). As we can see from the graph that the sales in the month of June of Brand \[A\] is \[57\]Lakh and the sales of Brand \[B\]in the month of June is \[54\] Lakh. Then the difference between them is \[(57-54)\]Lakh that means the answer is \[3\]Lakh.
d). To find the average of sales of Brand \[B\]we have to first find out the sum of sales of six months then divide it by \[6\]
\[\Rightarrow \left( \dfrac{36+38+43+35+45+54}{6} \right)\]
\[\Rightarrow \left( \dfrac{251}{6} \right)\]
\[\Rightarrow 41.83\]Lakh
e). To answer this, compare the sales of Brand \[A\] and Brand \[B\], we get April and June are the months in which sales of Brand \[B\] were less than the sales of Brand \[A\].
f). To find out the ratio of sales of Brand \[A\] to the sales of Brand \[B\] for the month of January, divide the sales of Brand \[A\] i.e. \[31\] Lakh and the sales of Brand \[B\] i.e. \[36\] Lakh , we get the ratio as \[31:36\].
Note: A double graph is a pictorial representation of the information of any two quantities. The bars of the double bar graph can be arranged in two ways and they are vertically and horizontally. By the use of the bar graphs we can easily understand the relation between the two quantities.
Complete step-by-step solution:
a). In This question the double graph is used to compare the sales of two brands and the two brands are Brand \[A\] and Brand \[B\].
b). To get the answer to this part we have to compare the sales of Brand \[A\] with the sale of Brand \[A\] from the previous month. So if we see, the sales in the month of January is \[31\] and in the month of February is \[34\]. Sales is increasing so we will similarly check for the next month as we know in February sales is \[34\]and in the month of March sales is \[30\]. This means that sales are decreasing from the previous month. So the answer is March.
c). As we can see from the graph that the sales in the month of June of Brand \[A\] is \[57\]Lakh and the sales of Brand \[B\]in the month of June is \[54\] Lakh. Then the difference between them is \[(57-54)\]Lakh that means the answer is \[3\]Lakh.
d). To find the average of sales of Brand \[B\]we have to first find out the sum of sales of six months then divide it by \[6\]
\[\Rightarrow \left( \dfrac{36+38+43+35+45+54}{6} \right)\]
\[\Rightarrow \left( \dfrac{251}{6} \right)\]
\[\Rightarrow 41.83\]Lakh
e). To answer this, compare the sales of Brand \[A\] and Brand \[B\], we get April and June are the months in which sales of Brand \[B\] were less than the sales of Brand \[A\].
f). To find out the ratio of sales of Brand \[A\] to the sales of Brand \[B\] for the month of January, divide the sales of Brand \[A\] i.e. \[31\] Lakh and the sales of Brand \[B\] i.e. \[36\] Lakh , we get the ratio as \[31:36\].
Note: A double graph is a pictorial representation of the information of any two quantities. The bars of the double bar graph can be arranged in two ways and they are vertically and horizontally. By the use of the bar graphs we can easily understand the relation between the two quantities.

Recently Updated Pages
Basicity of sulphurous acid and sulphuric acid are
Master Class 11 Business Studies: Engaging Questions & Answers for Success
Master Class 11 Computer Science: Engaging Questions & Answers for Success
Master Class 11 Economics: Engaging Questions & Answers for Success
Master Class 12 English: Engaging Questions & Answers for Success
Master Class 12 Social Science: Engaging Questions & Answers for Success
Trending doubts
What are gulf countries and why they are called Gulf class 8 social science CBSE
What is BLO What is the full form of BLO class 8 social science CBSE
What are the 12 elements of nature class 8 chemistry CBSE
In Indian rupees 1 trillion is equal to how many c class 8 maths CBSE
Who created the image of Bharat Mata for the first class 8 social science CBSE
What is the Balkan issue in brief class 8 social science CBSE