


How do you plot a graph for a decimal number with coordinates \[A(3.5,4)\] on a coordinate graph?
Answer
578.7k+ views
Hint: We will first find out the \[x\] and the \[y\] coordinates according to the question and then plot it in the graph. A coordinate graph is a diagram representing two number lines. One is the horizontal line called the \[x\] axis and the other one is the vertical line called the \[y\] axis. These two number lines are perpendicular to each other.
Complete step by step solution:
According to our question, we can say that we are having coordinates of a point on the graph. The coordinates are \[(3.5,4)\] and the point is \[A\]. When we are using a coordinate graph, we need to write the coordinates in a form that is \[(x,y)\]. Here, \[x\] is a point on the x-axis and \[y\] is a point on the y-axis.
So, if we see our question according to the form, then our \[x\] coordinates is \[3.5\] and \[y\] coordinate is \[4\]. Now, we will plot the graph according to the coordinates given.
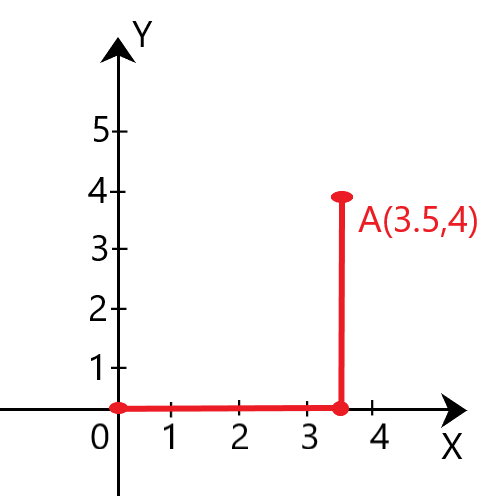
We will start with the \[x\] axis first. We can see that the coordinate of the \[x\] axis is positive. So, our point will be somewhere in the top right side of the graph. We will start from the origin first which is \[0\]. Then we will go \[3.5\] units to the right side of the graph on the \[x\] axis. We can point to the place when we reach \[3.5\] units.
Now, we will start with the \[y\] axis, and we will go to \[4\] units up on the axis because the \[y\] axis is in vertical position. And now when we reach our mark, we can point it and write the coordinates of \[x\] and \[y\]. Therefore, our plotting is done. We get our graph like this:
Note: The coordinate graph has two axes which are the horizontal \[x\] axis and vertical \[y\] axis. These two axes not only have positive axes, these also have negative axes downwards. There is also a \[z\] axis which is used while 3-D graph plotting.
Complete step by step solution:
According to our question, we can say that we are having coordinates of a point on the graph. The coordinates are \[(3.5,4)\] and the point is \[A\]. When we are using a coordinate graph, we need to write the coordinates in a form that is \[(x,y)\]. Here, \[x\] is a point on the x-axis and \[y\] is a point on the y-axis.
So, if we see our question according to the form, then our \[x\] coordinates is \[3.5\] and \[y\] coordinate is \[4\]. Now, we will plot the graph according to the coordinates given.
We will start with the \[x\] axis first. We can see that the coordinate of the \[x\] axis is positive. So, our point will be somewhere in the top right side of the graph. We will start from the origin first which is \[0\]. Then we will go \[3.5\] units to the right side of the graph on the \[x\] axis. We can point to the place when we reach \[3.5\] units.
Now, we will start with the \[y\] axis, and we will go to \[4\] units up on the axis because the \[y\] axis is in vertical position. And now when we reach our mark, we can point it and write the coordinates of \[x\] and \[y\]. Therefore, our plotting is done. We get our graph like this:
Note: The coordinate graph has two axes which are the horizontal \[x\] axis and vertical \[y\] axis. These two axes not only have positive axes, these also have negative axes downwards. There is also a \[z\] axis which is used while 3-D graph plotting.
Recently Updated Pages
Master Class 12 Economics: Engaging Questions & Answers for Success
Master Class 12 English: Engaging Questions & Answers for Success
Master Class 12 Social Science: Engaging Questions & Answers for Success
Master Class 12 Maths: Engaging Questions & Answers for Success
Master Class 12 Physics: Engaging Questions & Answers for Success
Master Class 9 General Knowledge: Engaging Questions & Answers for Success
Trending doubts
Find the sum of series 1 + 2 + 3 + 4 + 5 + + 100 class 9 maths CBSE
Difference Between Plant Cell and Animal Cell
Fill the blanks with the suitable prepositions 1 The class 9 english CBSE
What is pollution? How many types of pollution? Define it
Name 10 Living and Non living things class 9 biology CBSE
What is the full form of pH?