


In which city is the number of people watching TV the same as the number of people reading newspapers?
a). Mumbai
b). Delhi
c). Kolkata
d). Patna
Answer
597.3k+ views
Hint: To solve the above question we will use the concept of double graph. We can see from the above graph the x-axis represents different cities and for each city we are given two pieces of information : first is number of people reading newspapers and second is the number of people watching TV and y-axis represents the number of people. So, to find the city in which the number of people watching TV is the same as the number of people reading newspapers, we will first tabulate the above data and then find the answer.
Complete step by step answer:
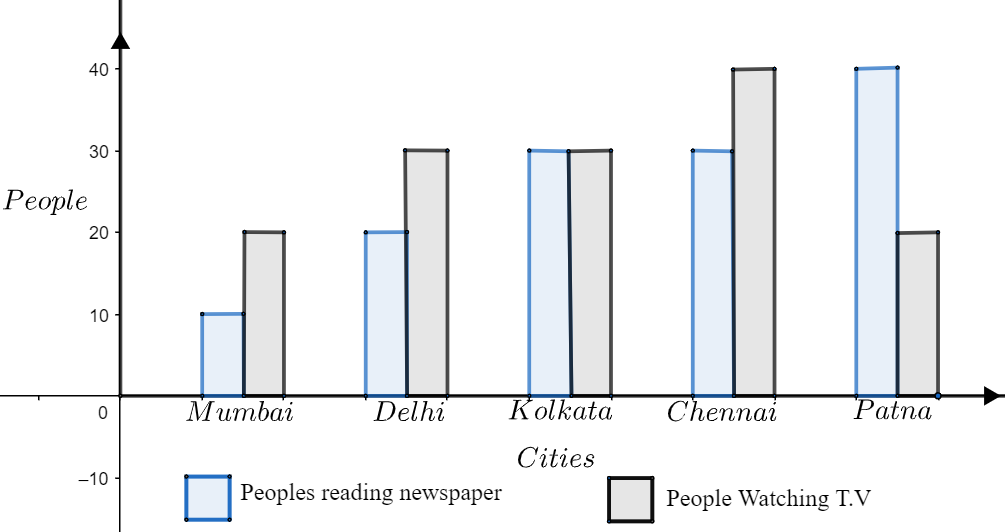
We can see that the bar graph given in the question is a double bar graph which represents the data of number of people reading newspapers and number of people watching TV in a particular city. The blue bar represents the number of people in a particular city who reads newspapers and the black bar represents the number of people who watches TV in a particular city.
And, on the x-axis we are given different cities and the y-axis represents the number of people reading newspapers or watching TV.
So, after analysing the given double bar graph we can say that in Mumbai the total number of people reading newspapers is 10 and the total number of people watching TV is 20.
Similarly, for city Delhi we can say that the total number of people reading newspapers is 20 and total number of people watching TV is 30.
Similarly, for Kolkata we can say that the total number of people reading newspapers is 30 and the total number of people watching TV is 30.
Similarly, for the city Chennai we can say that the total number of people reading newspapers is 30 and the total number of people watching TV is 40.
Similarly, for the city Patna we can say that the total number of people reading newspapers is 40 and the total number of people watching TV is 20.
Now, we will draw the table of the above data among cities, number of people reading newspapers and number of people watching TV.
Now, after tabulating the above data we will get the following table:
So, from the table we see that for Kolkata the number of people reading newspapers is equal to the number of people watching TV which is equal to 30.
Hence, Kolkata is our correct answer.
So, the correct answer is “Option C”.
Note: It is not necessary to draw the table and write the values for each city. Since, we have been asked to find the city where the number of people watching TV is the same as the number of people reading the newspaper, we can easily identify from the graph that Kolkata has both the bars in the same level, so that will be the answer.
In double bar graph students are required to note that there are two bars and each bar represents a specific type of information about a particular item. Similarly, we can have a multi-bar graph in which multiple bars represent multiple information about a particular item in a single graph. Our question is a double bar graph. An example for a multi bar graph - We want to create a graph which represents population growth (in millions) for 5 different countries in 5 different years. Then, we will use a multi graph here to represent them on a single graph.
Complete step by step answer:
We can see that the bar graph given in the question is a double bar graph which represents the data of number of people reading newspapers and number of people watching TV in a particular city. The blue bar represents the number of people in a particular city who reads newspapers and the black bar represents the number of people who watches TV in a particular city.
And, on the x-axis we are given different cities and the y-axis represents the number of people reading newspapers or watching TV.
So, after analysing the given double bar graph we can say that in Mumbai the total number of people reading newspapers is 10 and the total number of people watching TV is 20.
Similarly, for city Delhi we can say that the total number of people reading newspapers is 20 and total number of people watching TV is 30.
Similarly, for Kolkata we can say that the total number of people reading newspapers is 30 and the total number of people watching TV is 30.
Similarly, for the city Chennai we can say that the total number of people reading newspapers is 30 and the total number of people watching TV is 40.
Similarly, for the city Patna we can say that the total number of people reading newspapers is 40 and the total number of people watching TV is 20.
Now, we will draw the table of the above data among cities, number of people reading newspapers and number of people watching TV.
Now, after tabulating the above data we will get the following table:
| Cities | Mumbai | Delhi | Kolkata | Chennai | Patna |
| Number of people reading newspaper | 10 | 20 | 30 | 30 | 40 |
| Number of people watching TV | 20 | 30 | 30 | 40 | 20 |
So, from the table we see that for Kolkata the number of people reading newspapers is equal to the number of people watching TV which is equal to 30.
Hence, Kolkata is our correct answer.
So, the correct answer is “Option C”.
Note: It is not necessary to draw the table and write the values for each city. Since, we have been asked to find the city where the number of people watching TV is the same as the number of people reading the newspaper, we can easily identify from the graph that Kolkata has both the bars in the same level, so that will be the answer.
In double bar graph students are required to note that there are two bars and each bar represents a specific type of information about a particular item. Similarly, we can have a multi-bar graph in which multiple bars represent multiple information about a particular item in a single graph. Our question is a double bar graph. An example for a multi bar graph - We want to create a graph which represents population growth (in millions) for 5 different countries in 5 different years. Then, we will use a multi graph here to represent them on a single graph.
Recently Updated Pages
Three beakers labelled as A B and C each containing 25 mL of water were taken A small amount of NaOH anhydrous CuSO4 and NaCl were added to the beakers A B and C respectively It was observed that there was an increase in the temperature of the solutions contained in beakers A and B whereas in case of beaker C the temperature of the solution falls Which one of the following statements isarecorrect i In beakers A and B exothermic process has occurred ii In beakers A and B endothermic process has occurred iii In beaker C exothermic process has occurred iv In beaker C endothermic process has occurred
Master Class 9 Social Science: Engaging Questions & Answers for Success
Master Class 9 Science: Engaging Questions & Answers for Success
Master Class 9 Maths: Engaging Questions & Answers for Success
Master Class 9 General Knowledge: Engaging Questions & Answers for Success
Class 9 Question and Answer - Your Ultimate Solutions Guide
Three beakers labelled as A B and C each containing 25 mL of water were taken A small amount of NaOH anhydrous CuSO4 and NaCl were added to the beakers A B and C respectively It was observed that there was an increase in the temperature of the solutions contained in beakers A and B whereas in case of beaker C the temperature of the solution falls Which one of the following statements isarecorrect i In beakers A and B exothermic process has occurred ii In beakers A and B endothermic process has occurred iii In beaker C exothermic process has occurred iv In beaker C endothermic process has occurred
Master Class 9 Social Science: Engaging Questions & Answers for Success
Master Class 9 Science: Engaging Questions & Answers for Success
Trending doubts
Find the sum of series 1 + 2 + 3 + 4 + 5 + + 100 class 9 maths CBSE
What is the Full Form of ISI and RAW
Fill the blanks with the suitable prepositions 1 The class 9 english CBSE
Difference Between Plant Cell and Animal Cell
Who is eligible for RTE class 9 social science CBSE
What is pollution? How many types of pollution? Define it