


In the plots of radial distribution function for the hydrogen 3s orbital vs ‘r’ , the number of peaks are:
A.3
B.2
C.1
D.0
Answer
626.4k+ views
Hint: To find the number of peaks , draw the 3s vs ‘r’ graph for hydrogen atom. Or to calculate theoretically , find the number of the radial nodes of the distribution . Radial node +1 will give us the number of peaks.
Complete answer:
Schrodinger gave the electron wave equation which tells us the maximum probability of finding the electron. The equation is: \[\dfrac{{{\partial ^2}\varphi }}{{\partial {x^2}}} + \dfrac{{{\partial ^2}\varphi }}{{\partial {y^2}}} + \dfrac{{{\partial ^2}\varphi }}{{\partial {z^2}}} + \dfrac{{2m}}{{{h^2}}}(E - U)\varphi = 0\]
where $\varphi $ = wave function of the matter ( electron ) wave. ${\varphi ^2}$ is the probability distribution of electrons. This tells us where the electron is most probable to be found. For 3s electrons we will find the value of principal quantum number and azimuthal quantum number. Here ,
$n$ ( principal quantum number)= 3 $l$( azimuthal quantum number)=0 ( for s- orbital , value of $l$is 0).
We will now try to draw the graph of 3s versus ‘r’ . Before that we need to keep following points in mind:
-Calculate the number of radial nodes using the formula $n - l - 1$.
-Radial nodes= number of cuts on x-axis ( r).
-The curve should start from zero. It can be positive or negative.
-Size of the curve increases after touching the x- axis every time .
-By keeping all this, we get the following curve:
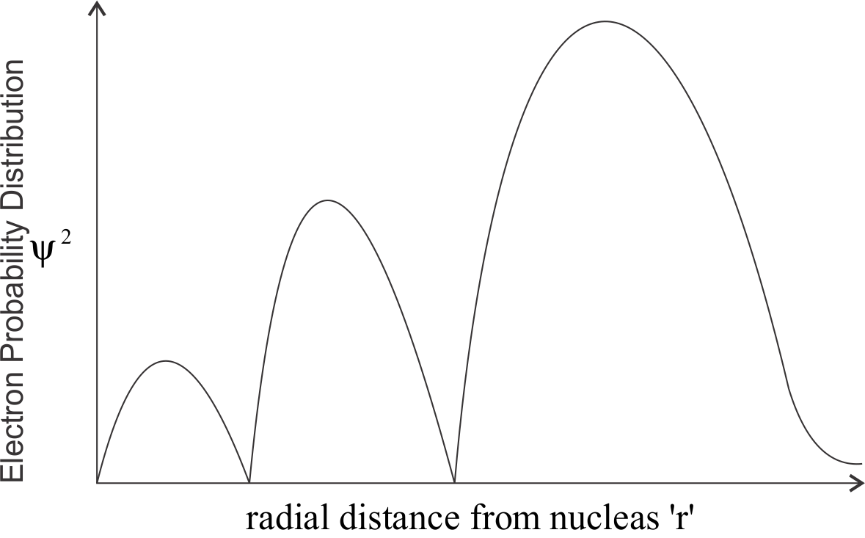
We can clearly observe the number of peaks which is 3. The graph touches the x- axis two times , hence the number of radial nodes is 2.
So by this observation we can say that the correct answer would be option B.
Note:
A node refers to a region where the probability of finding an electron is zero. The number of radial and angular nodes differ from orbital to orbital.
Complete answer:
Schrodinger gave the electron wave equation which tells us the maximum probability of finding the electron. The equation is: \[\dfrac{{{\partial ^2}\varphi }}{{\partial {x^2}}} + \dfrac{{{\partial ^2}\varphi }}{{\partial {y^2}}} + \dfrac{{{\partial ^2}\varphi }}{{\partial {z^2}}} + \dfrac{{2m}}{{{h^2}}}(E - U)\varphi = 0\]
where $\varphi $ = wave function of the matter ( electron ) wave. ${\varphi ^2}$ is the probability distribution of electrons. This tells us where the electron is most probable to be found. For 3s electrons we will find the value of principal quantum number and azimuthal quantum number. Here ,
$n$ ( principal quantum number)= 3 $l$( azimuthal quantum number)=0 ( for s- orbital , value of $l$is 0).
We will now try to draw the graph of 3s versus ‘r’ . Before that we need to keep following points in mind:
-Calculate the number of radial nodes using the formula $n - l - 1$.
-Radial nodes= number of cuts on x-axis ( r).
-The curve should start from zero. It can be positive or negative.
-Size of the curve increases after touching the x- axis every time .
-By keeping all this, we get the following curve:
We can clearly observe the number of peaks which is 3. The graph touches the x- axis two times , hence the number of radial nodes is 2.
So by this observation we can say that the correct answer would be option B.
Note:
A node refers to a region where the probability of finding an electron is zero. The number of radial and angular nodes differ from orbital to orbital.
Recently Updated Pages
Basicity of sulphurous acid and sulphuric acid are
Master Class 12 Economics: Engaging Questions & Answers for Success
Master Class 12 Biology: Engaging Questions & Answers for Success
Master Class 11 English: Engaging Questions & Answers for Success
Master Class 11 Physics: Engaging Questions & Answers for Success
Master Class 11 Computer Science: Engaging Questions & Answers for Success
Trending doubts
Draw a labelled sketch of the human eye class 12 physics CBSE
The chemical formula of tear gas is A CO Cl 2 B C 10 class 12 chemistry CBSE
Draw ray diagrams each showing i myopic eye and ii class 12 physics CBSE
Which are the Top 10 Largest Countries of the World?
Differentiate between homogeneous and heterogeneous class 12 chemistry CBSE
Which is the correct genotypic ratio of mendel dihybrid class 12 biology CBSE