


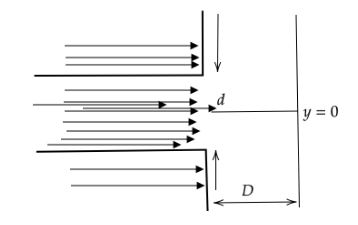
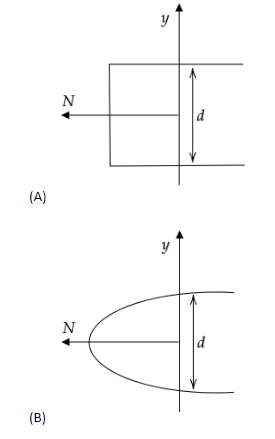
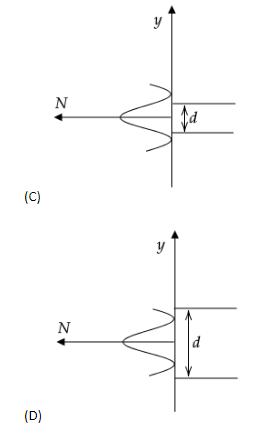
In an electron experiment, electrons are made to pass through a narrow slit of width \['d'\] comparable to their de Broglie wavelength. They are detected on a screen at a distance \[D\] from the slit. Which of the following graphs can be expected to represent the numbers of electrons \['N'\] detected as a function of the detector position \['y'\] (\[y=0\] corresponds to the middle of the slit)?
Answer
597.9k+ views
Hint: From the above experimental observations, an electron or an electron beam can be regarded as a wave much like sound or water waves. This technique is similar to X-ray and neutron diffraction, and is most frequently used in solid-state physics and chemistry to analyse the crystal structure of solids. Keep in mind that diffraction means bending away at the edges.
Complete solution:
Electron diffraction forms a foundation to prove the wave nature of electrons. However, it may also be regarded simply as a technique used to study matter by firing electrons at a sample and observing the resulting interference pattern; this phenomenon is called wave-particle duality and states that a particle of matter such as an incident electron can be described as a wave.
To find out the resulting graph, let’s analyse the situation. The electron beams at the edges of the slit will deflect away from the central line, on both the ends of the slit. The electron beam along or near the central line will not diffract or deviate. Thus, the resulting diffraction pattern is wider than the slit width.
This pattern is observed in the option (C) hence it is the correct answer.
Note: Let us analyse the errors in the diffraction pattern of the other options. Any diffraction experiment can never form a rectangular, square or elliptical diffraction pattern or graph and hence options (A) and (B) cannot be the correct options. In option (D), the slit width is more than the diffraction pattern width, which means that the electron beam has been diffracted inwards which is false assessment as well.
Recently Updated Pages
Master Class 12 Business Studies: Engaging Questions & Answers for Success
Master Class 12 Biology: Engaging Questions & Answers for Success
Master Class 12 Chemistry: Engaging Questions & Answers for Success
Class 12 Question and Answer - Your Ultimate Solutions Guide
Master Class 11 Social Science: Engaging Questions & Answers for Success
Master Class 11 English: Engaging Questions & Answers for Success
Trending doubts
Which is more stable and why class 12 chemistry CBSE
Which are the Top 10 Largest Countries of the World?
Draw a labelled sketch of the human eye class 12 physics CBSE
Differentiate between homogeneous and heterogeneous class 12 chemistry CBSE
What are the major means of transport Explain each class 12 social science CBSE
Sulphuric acid is known as the king of acids State class 12 chemistry CBSE