


In a certain circuit consisting of a constant e.m.f. E, an inductance L and a resistance R is closed, the current in it increases with time according to curve 1. After one parameter (E, L or R) is changed the increase in current follows curve 2, when the circuit is closed second time. Which parameter was changed and in what direction?

Answer
589.2k+ views
Hint
Use the slope of the given graph to know which one is more or less and then using the formula of self-inductance we can find its proportionality with the slope and hence we can know what changes have occurred in the parameters. Here,
$ L\text{ }\alpha \text{ }\dfrac{1}{\dfrac{dI}{dt}} $
Self inductance is defined as the induction of a voltage in a current carrying wire when the current in the wire itself is changing. Self induction is the way in which single coils and chokes operate.
Complete step by step solution
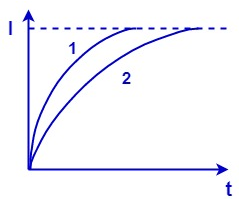
Here, slope of the graph is $ \dfrac{dI}{dt} $
We can clearly see from the given graph that
Slope of curve 1 > slope of curve 2 i.e.
$ {{\left( \dfrac{dI}{dt} \right)}_{1}}>{{\left( \dfrac{dI}{dt} \right)}_{2}} $
As we know,
$ V=L\dfrac{dI}{dt} $
We can clearly see that L is inversely proportional to $ \dfrac{dI}{dt} $ i.e.
$ L\text{ }\alpha \text{ }\dfrac{1}{\dfrac{dI}{dt}} $
Now if slope i.e. $ \dfrac{dI}{dt} $ is decreasing along the curve 2 that means that the self-inductance i.e. L is increasing here.
Or we can say
$ {{L}_{2}}>{{L}_{1}} $
Hence, the changed parameter here is self-inductance L which has increased during the increase in current along the curve 2.
Note
Remember that the self-inductance is directly proportional to $ \dfrac{dt}{dI} $ which is the inverse of the slope in the given figure. Had there been the graph of time vs current with the same curves, the self-inductance would have been said to decrease with the decrease in slope of curve 2.
Use the slope of the given graph to know which one is more or less and then using the formula of self-inductance we can find its proportionality with the slope and hence we can know what changes have occurred in the parameters. Here,
$ L\text{ }\alpha \text{ }\dfrac{1}{\dfrac{dI}{dt}} $
Self inductance is defined as the induction of a voltage in a current carrying wire when the current in the wire itself is changing. Self induction is the way in which single coils and chokes operate.
Complete step by step solution
Here, slope of the graph is $ \dfrac{dI}{dt} $
We can clearly see from the given graph that
Slope of curve 1 > slope of curve 2 i.e.
$ {{\left( \dfrac{dI}{dt} \right)}_{1}}>{{\left( \dfrac{dI}{dt} \right)}_{2}} $
As we know,
$ V=L\dfrac{dI}{dt} $
We can clearly see that L is inversely proportional to $ \dfrac{dI}{dt} $ i.e.
$ L\text{ }\alpha \text{ }\dfrac{1}{\dfrac{dI}{dt}} $
Now if slope i.e. $ \dfrac{dI}{dt} $ is decreasing along the curve 2 that means that the self-inductance i.e. L is increasing here.
Or we can say
$ {{L}_{2}}>{{L}_{1}} $
Hence, the changed parameter here is self-inductance L which has increased during the increase in current along the curve 2.
Note
Remember that the self-inductance is directly proportional to $ \dfrac{dt}{dI} $ which is the inverse of the slope in the given figure. Had there been the graph of time vs current with the same curves, the self-inductance would have been said to decrease with the decrease in slope of curve 2.
Recently Updated Pages
Master Class 12 Business Studies: Engaging Questions & Answers for Success
Master Class 12 Biology: Engaging Questions & Answers for Success
Master Class 12 Chemistry: Engaging Questions & Answers for Success
Class 12 Question and Answer - Your Ultimate Solutions Guide
Master Class 11 Social Science: Engaging Questions & Answers for Success
Master Class 11 English: Engaging Questions & Answers for Success
Trending doubts
Which is more stable and why class 12 chemistry CBSE
What are the major means of transport Explain each class 12 social science CBSE
The value of constant k in coulombs law is beginalign class 12 physics CBSE
The first microscope was invented by A Leeuwenhoek class 12 biology CBSE
What is the Full Form of 1.DPT 2.DDT 3.BCG
What is the Full Form of PVC, PET, HDPE, LDPE, PP and PS ?