


How do you graph the line $x - y = 4$ ?
Answer
553.5k+ views
Hint: A graph of a function f is the set of ordered pairs; the equation of graph is generally represented as $y = f\left( x \right)$ , where x and f(x) are real numbers. We substitute the value of x and we determine the value of y and then we mark the points in the graph and we join the points.
Complete step by step solution:
Here in this question, we have to plot the graph for the given function. A graph of a function is a set of ordered pairs and it is represented as $y = f\left( x \right)$, where x and f(x) are real numbers. These pairs are in the form of cartesian form and the graph is the two-dimensional graph.
First, we have to find the value of y by using the graph equation $x - y = 4$. Let we substitute the value of x as $1$, $2$, $3$ and $4$.
Now we consider the value of x as $1$ , the value of y is
$ \Rightarrow y = x - 4$
$ \Rightarrow y = 1 - 4$
$ \Rightarrow y = - 3$
Now we consider the value of x as $2$, the value of y is
$ \Rightarrow y = x - 4$
$ \Rightarrow y = 2 - 4$
$ \Rightarrow y = - 2$
Now we consider the value of x as $3$, the value of y is
$ \Rightarrow y = x - 4$
$ \Rightarrow y = 3 - 4$
$ \Rightarrow y = - 1$
Now we consider the value of x as $4$, the value of y is
$ \Rightarrow y = x - 4$
$ \Rightarrow y = 4 - 4$
$ \Rightarrow y = 0$
Now we draw a table for these values we have
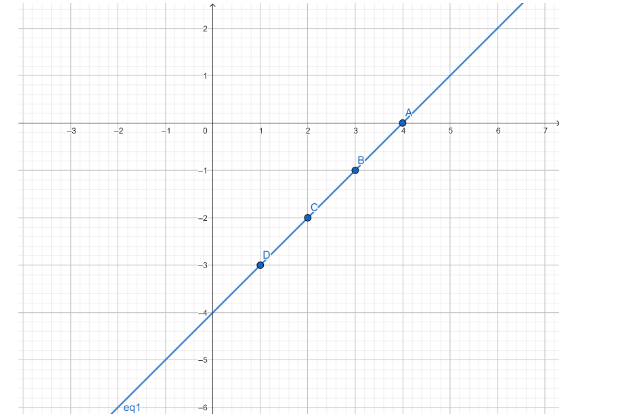
The graph plotted for this point is represented below:
Note: The graph is plotted x-axis versus y axis. The graph is two dimensional. By the equation of a graph, we can plot the graph by assuming the value of x. we can’t assume the value of y. because the value of y depends on the value of x. Hence, we have plotted the graph.
Complete step by step solution:
Here in this question, we have to plot the graph for the given function. A graph of a function is a set of ordered pairs and it is represented as $y = f\left( x \right)$, where x and f(x) are real numbers. These pairs are in the form of cartesian form and the graph is the two-dimensional graph.
First, we have to find the value of y by using the graph equation $x - y = 4$. Let we substitute the value of x as $1$, $2$, $3$ and $4$.
Now we consider the value of x as $1$ , the value of y is
$ \Rightarrow y = x - 4$
$ \Rightarrow y = 1 - 4$
$ \Rightarrow y = - 3$
Now we consider the value of x as $2$, the value of y is
$ \Rightarrow y = x - 4$
$ \Rightarrow y = 2 - 4$
$ \Rightarrow y = - 2$
Now we consider the value of x as $3$, the value of y is
$ \Rightarrow y = x - 4$
$ \Rightarrow y = 3 - 4$
$ \Rightarrow y = - 1$
Now we consider the value of x as $4$, the value of y is
$ \Rightarrow y = x - 4$
$ \Rightarrow y = 4 - 4$
$ \Rightarrow y = 0$
Now we draw a table for these values we have
| x | $4$ | $3$ | $2$ | $1$ |
| y | $0$ | $ - 1$ | $ - 2$ | $ - 3$ |
The graph plotted for this point is represented below:
Note: The graph is plotted x-axis versus y axis. The graph is two dimensional. By the equation of a graph, we can plot the graph by assuming the value of x. we can’t assume the value of y. because the value of y depends on the value of x. Hence, we have plotted the graph.

Recently Updated Pages
Basicity of sulphurous acid and sulphuric acid are
Master Class 11 Business Studies: Engaging Questions & Answers for Success
Master Class 11 Computer Science: Engaging Questions & Answers for Success
Master Class 11 Economics: Engaging Questions & Answers for Success
Master Class 12 English: Engaging Questions & Answers for Success
Master Class 12 Social Science: Engaging Questions & Answers for Success
Trending doubts
What are gulf countries and why they are called Gulf class 8 social science CBSE
Name the states through which the Tropic of Cancer class 8 social science CBSE
What is BLO What is the full form of BLO class 8 social science CBSE
What are the 12 elements of nature class 8 chemistry CBSE
In Indian rupees 1 trillion is equal to how many c class 8 maths CBSE
Citizens of India can vote at the age of A 18 years class 8 social science CBSE