


How do you graph the inequality $ x > 1 $ ?
Answer
580.2k+ views
Hint: In this question we need to graph the inequality $ x > 1 $ . Here, we will understand the concept first, then the conditions that we have to graph an inequality. Finally, we will construct the graph for the inequality $ x > 1 $ .
Complete step-by-step answer:
Here, we need to graph the inequality $ x > 1 $ .
Before graphing let us understand some concepts.
First, let us know about what is a linear inequality. A linear inequality is an inequality which involves linear function and it contains one of the symbols of inequality like $ < ,\, > ,\, \leqslant ,\, \geqslant ,\, \ne ,\, = $ . It exactly looks like a linear equation.
The given equation is a one variable, so if the given inequality is $ < $ or $ > $ , we will use an open dot to indicate that the endpoint of the ray is not part of the solution. For the inequality $ \leqslant $ or $ \geqslant $ , we will use closed dots.
Thus, we will make an open dot as the given inequality is $ > $ .
As the given equality is $ x > 1 $ , the graph will have a vertical line at $ 1 $ on the horizontal axis.
And, the shaded region will be on the right side because the inequality operator contains greater than.
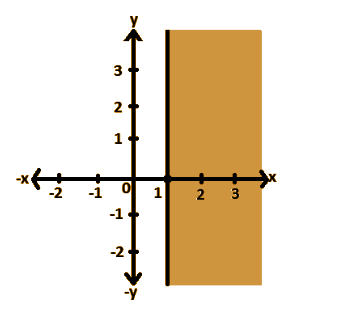
Thus, this is the graph for the inequality $ x > 1 $ .
Note: Generally, to graph a linear inequality with two variables first let us rearrange the equation which contains a single variable on one side of the equation and the other terms on the other side. If the inequality is $ \leqslant $ or $ \geqslant $ then we will make a solid line, if it is $ < $ or $ > $ then we will make a dashed line. Then shade above for a greater than and below for a lesser than.
Complete step-by-step answer:
Here, we need to graph the inequality $ x > 1 $ .
Before graphing let us understand some concepts.
First, let us know about what is a linear inequality. A linear inequality is an inequality which involves linear function and it contains one of the symbols of inequality like $ < ,\, > ,\, \leqslant ,\, \geqslant ,\, \ne ,\, = $ . It exactly looks like a linear equation.
The given equation is a one variable, so if the given inequality is $ < $ or $ > $ , we will use an open dot to indicate that the endpoint of the ray is not part of the solution. For the inequality $ \leqslant $ or $ \geqslant $ , we will use closed dots.
Thus, we will make an open dot as the given inequality is $ > $ .
As the given equality is $ x > 1 $ , the graph will have a vertical line at $ 1 $ on the horizontal axis.
And, the shaded region will be on the right side because the inequality operator contains greater than.
Thus, this is the graph for the inequality $ x > 1 $ .
Note: Generally, to graph a linear inequality with two variables first let us rearrange the equation which contains a single variable on one side of the equation and the other terms on the other side. If the inequality is $ \leqslant $ or $ \geqslant $ then we will make a solid line, if it is $ < $ or $ > $ then we will make a dashed line. Then shade above for a greater than and below for a lesser than.
Recently Updated Pages
Master Class 11 English: Engaging Questions & Answers for Success
Master Class 11 Social Science: Engaging Questions & Answers for Success
Master Class 11 Maths: Engaging Questions & Answers for Success
Master Class 11 Biology: Engaging Questions & Answers for Success
Master Class 11 Physics: Engaging Questions & Answers for Success
Master Class 11 Chemistry: Engaging Questions & Answers for Success
Trending doubts
In Indian rupees 1 trillion is equal to how many c class 8 maths CBSE
What is BLO What is the full form of BLO class 8 social science CBSE
What are the 12 elements of nature class 8 chemistry CBSE
Citizens of India can vote at the age of A 18 years class 8 social science CBSE
Which of the following leader has given the term insensate class 8 social science CBSE
Name the states through which the Tropic of Cancer class 8 social science CBSE