


How do you graph \[r=2+\sin \theta \]?
Answer
558k+ views
Hint: First let us assume \[x=r\cos \theta ,y=r\sin \theta ,r=\sqrt{{{x}^{2}}+{{y}^{2}}}\]. Now we should use these assumptions such that we can get the given equation in rectangular coordinates form. Now we can draw the graph of the function obtained in the form of rectangular coordinates by plotting. We should assume the values of x and we should find out the values of y such that the graph can be drawn.
Complete step-by-step solution:
From the question, we were given a graph \[r=2+\sin \theta \]. So, it is clear that we have to draw the graph of \[r=2+\sin \theta \].
Let us assume \[x=r\cos \theta ,y=r\sin \theta \].
Let us assume \[r=2+\sin \theta \] as equation (1).
\[r=2+\sin \theta .....(1)\]
Now we should multiply equation (1) with r on both sides, then we get
\[\Rightarrow {{r}^{2}}=2r+r\sin \theta .....(2)\]
Now let us place \[x=r\cos \theta ,y=r\sin \theta ,r=\sqrt{{{x}^{2}}+{{y}^{2}}}\] in equation (2), then we get
\[\begin{align}
& \Rightarrow {{r}^{2}}=2r+r\sin \theta \\
& \Rightarrow {{x}^{2}}+{{y}^{2}}=2\sqrt{{{x}^{2}}+{{y}^{2}}}+y.....(3) \\
\end{align}\]
Now we should draw the graph of equation (3).
Let us substitute the value of x is equal to 0 in equation (3).
\[\begin{align}
& \Rightarrow {{y}^{2}}=3y \\
& \Rightarrow {{y}^{2}}-3y=0 \\
& \Rightarrow y=0,3 \\
\end{align}\]
Let us substitute the value of y is equal to 0 in equation (3).
\[\begin{align}
& \Rightarrow {{x}^{2}}=2x \\
& \Rightarrow {{x}^{2}}=2x \\
& \Rightarrow {{x}^{2}}-2x=0 \\
& \Rightarrow x=0,2 \
\end{align}\]
So, it is clear that the graph passed through \[\left( 0,0 \right),\left( 2,0 \right),\left( 0,3 \right)\].
Now let us draw the graph such that the graph passes through \[\left( 0,0 \right),\left( 2,0 \right),\left( 0,3 \right)\].
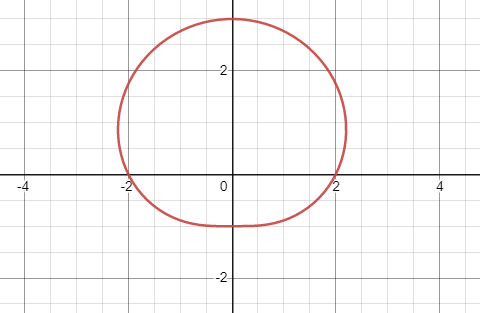
The above graph represents the graph of \[r=2+\sin \theta \].
Note: Students should be able to plot the graph in a correct manner. While plotting the graph, the points should be calculated such that there should be no calculation mistake. If a small mistake is done, then the graph may get interrupted. So, calculation mistakes should be avoided while solving this problem.
Complete step-by-step solution:
From the question, we were given a graph \[r=2+\sin \theta \]. So, it is clear that we have to draw the graph of \[r=2+\sin \theta \].
Let us assume \[x=r\cos \theta ,y=r\sin \theta \].
Let us assume \[r=2+\sin \theta \] as equation (1).
\[r=2+\sin \theta .....(1)\]
Now we should multiply equation (1) with r on both sides, then we get
\[\Rightarrow {{r}^{2}}=2r+r\sin \theta .....(2)\]
Now let us place \[x=r\cos \theta ,y=r\sin \theta ,r=\sqrt{{{x}^{2}}+{{y}^{2}}}\] in equation (2), then we get
\[\begin{align}
& \Rightarrow {{r}^{2}}=2r+r\sin \theta \\
& \Rightarrow {{x}^{2}}+{{y}^{2}}=2\sqrt{{{x}^{2}}+{{y}^{2}}}+y.....(3) \\
\end{align}\]
Now we should draw the graph of equation (3).
Let us substitute the value of x is equal to 0 in equation (3).
\[\begin{align}
& \Rightarrow {{y}^{2}}=3y \\
& \Rightarrow {{y}^{2}}-3y=0 \\
& \Rightarrow y=0,3 \\
\end{align}\]
Let us substitute the value of y is equal to 0 in equation (3).
\[\begin{align}
& \Rightarrow {{x}^{2}}=2x \\
& \Rightarrow {{x}^{2}}=2x \\
& \Rightarrow {{x}^{2}}-2x=0 \\
& \Rightarrow x=0,2 \
\end{align}\]
So, it is clear that the graph passed through \[\left( 0,0 \right),\left( 2,0 \right),\left( 0,3 \right)\].
Now let us draw the graph such that the graph passes through \[\left( 0,0 \right),\left( 2,0 \right),\left( 0,3 \right)\].
The above graph represents the graph of \[r=2+\sin \theta \].
Note: Students should be able to plot the graph in a correct manner. While plotting the graph, the points should be calculated such that there should be no calculation mistake. If a small mistake is done, then the graph may get interrupted. So, calculation mistakes should be avoided while solving this problem.
Recently Updated Pages
Master Class 11 English: Engaging Questions & Answers for Success
Master Class 11 Social Science: Engaging Questions & Answers for Success
Master Class 11 Maths: Engaging Questions & Answers for Success
Master Class 11 Biology: Engaging Questions & Answers for Success
Master Class 11 Physics: Engaging Questions & Answers for Success
Master Class 11 Chemistry: Engaging Questions & Answers for Success
Trending doubts
One Metric ton is equal to kg A 10000 B 1000 C 100 class 11 physics CBSE
Difference Between Prokaryotic Cells and Eukaryotic Cells
Find the value of the expression given below sin 30circ class 11 maths CBSE
Difference between physical and chemical change class 11 chemistry CBSE
Two of the body parts which do not appear in MRI are class 11 biology CBSE
Draw a diagram of a plant cell and label at least eight class 11 biology CBSE