


How do you graph $ 3x-2y\ge 6 $ ?
Answer
555.3k+ views
Hint: First construct the equation of the boundary line for the given inequality by replacing the inequality sign by the equality sign. Then draw the line by finding its intercepts. Later, find the region of the inequality according to the sign in the inequality.
Complete step by step solution:
The given inequality in the question is $ 3x-2y\ge 6 $ .
First write the inequality in the form $ ay+bx\ge c $ .
Therefore, multiply the given inequality with (-1).
Then, we get that $ 2y-3x\le -6 $
To plot the graph of such type of inequality in 2 variables, first draw the graph of the line which we get by replacing the inequality sign by the equality sign.
In this case, we have replaced the ‘ $ \ge $ ’ by ‘=’ sign.
With this, the equation of the line is $ 3x-2y=6 $ …. (i)
Substitute $ x=0 $ in equation (i) to find the y intercept of the line.
Then,
$ \Rightarrow 3(0)-2y=6 $
$ \Rightarrow y=-3 $
Now, substitute $ y=0 $ in equation (i) to find the x intercept of the line.
Then,
$ \Rightarrow 3x-2(0)=6 $
$ \Rightarrow x=2 $
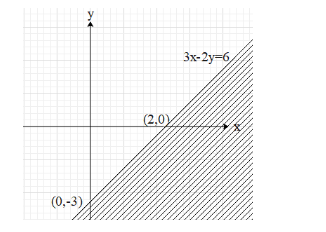
This means that the x and the y intercepts of the required line are $ (2,0) $ and $ (0,-3) $ respectively.
Now, plot the two points, $ (2,0) $ and $ (0,-3) $ on a cartesian plane and then join the two points by drawing a line, passing through them.
Since in the inequality it is less than or equal to sign, the graph for the inequality is the region below the line $ 3x-2y=6 $ , as shown below.
Note: Note that the graph of an inequality is a region and not a curve like we have for the graph of equations.
Suppose the inequality given was $ 3x-2y\le 6 $ .
Then, the region for the inequality would be above the line $ 3x-2y=6 $ .
It is the same for the greater than or less than signs too.
Complete step by step solution:
The given inequality in the question is $ 3x-2y\ge 6 $ .
First write the inequality in the form $ ay+bx\ge c $ .
Therefore, multiply the given inequality with (-1).
Then, we get that $ 2y-3x\le -6 $
To plot the graph of such type of inequality in 2 variables, first draw the graph of the line which we get by replacing the inequality sign by the equality sign.
In this case, we have replaced the ‘ $ \ge $ ’ by ‘=’ sign.
With this, the equation of the line is $ 3x-2y=6 $ …. (i)
Substitute $ x=0 $ in equation (i) to find the y intercept of the line.
Then,
$ \Rightarrow 3(0)-2y=6 $
$ \Rightarrow y=-3 $
Now, substitute $ y=0 $ in equation (i) to find the x intercept of the line.
Then,
$ \Rightarrow 3x-2(0)=6 $
$ \Rightarrow x=2 $
This means that the x and the y intercepts of the required line are $ (2,0) $ and $ (0,-3) $ respectively.
Now, plot the two points, $ (2,0) $ and $ (0,-3) $ on a cartesian plane and then join the two points by drawing a line, passing through them.
Since in the inequality it is less than or equal to sign, the graph for the inequality is the region below the line $ 3x-2y=6 $ , as shown below.
Note: Note that the graph of an inequality is a region and not a curve like we have for the graph of equations.
Suppose the inequality given was $ 3x-2y\le 6 $ .
Then, the region for the inequality would be above the line $ 3x-2y=6 $ .
It is the same for the greater than or less than signs too.

Recently Updated Pages
Basicity of sulphurous acid and sulphuric acid are
Master Class 8 Social Science: Engaging Questions & Answers for Success
Master Class 8 Science: Engaging Questions & Answers for Success
Master Class 8 Maths: Engaging Questions & Answers for Success
Class 8 Question and Answer - Your Ultimate Solutions Guide
Master Class 11 Business Studies: Engaging Questions & Answers for Success
Trending doubts
What are gulf countries and why they are called Gulf class 8 social science CBSE
What is BLO What is the full form of BLO class 8 social science CBSE
What are the 12 elements of nature class 8 chemistry CBSE
In Indian rupees 1 trillion is equal to how many c class 8 maths CBSE
Who created the image of Bharat Mata for the first class 8 social science CBSE
What is the Balkan issue in brief class 8 social science CBSE