


How do you graph \[y=\sqrt{-x}\] and how does it compare to the parent function?
Answer
552.9k+ views
Hint: In this problem we have given an equation and we have been asked to draw the graph of the given equation and compare the equation to the parent equation. The parent graph is the graph that shows relatively the simplest form of the equation and transforming the function, the respective graph can be changed accordingly.
Complete step-by-step answer:
We have given that,
\[y=\sqrt{-x}\]
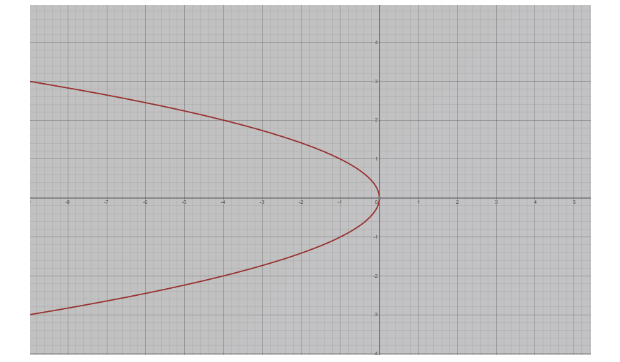
The parent equation of the given function is given as;
\[{{y}^{2}}=-x\]
Here,
\[{{y}^{2}}=-x\ge 0\]
The above equation represents the equation of the parabola.
Graph of \[{{y}^{2}}=-x\] is as follows;
Now,
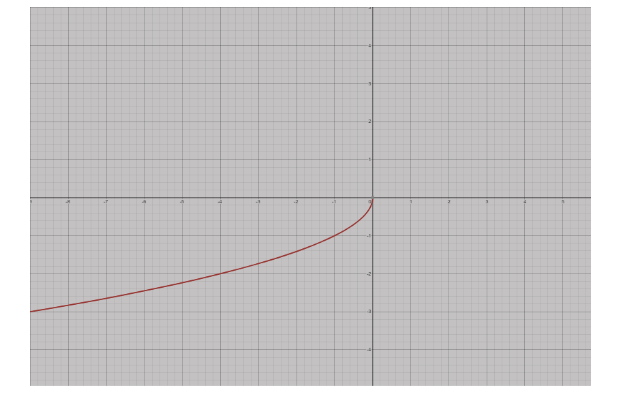
The combined equation of \[{{y}^{2}}=-x\] representing the semi parabolas,
We have,
\[{{y}^{2}}=-x\]
Then,
\[y=\sqrt{-x}\] , where \[y\ge 0\]
The graph of the above equation representing the semi parabola is as follows;

And,
\[y=-\sqrt{-x}\] , where \[y\le 0\]
The graph of the above equation representing the semi parabola is as follows;
Thus,
The parent equation \[{{y}^{2}}=-x\] where \[{{y}^{2}}=-x\ge 0\] is the equation of the parabola or representing the parabola and it is the combined equation for the two semi parabolas i.e. the combined equation for the pair \[y=\sqrt{-x}\] where \[y\ge 0\] and \[y=-\sqrt{-x}\] , where \[y\le 0\] .
Note: In such types of questions, most of the students do mistakes while drawing the graph. First we need to find the range and the domain of the function. Then draw the graph of a parent equation i.e. parent graph as every function has their parent function there is only that the graph undergo transformation according to the function i.e. they are known as child function as they are only used to add elements to the parent function.
Complete step-by-step answer:
We have given that,
\[y=\sqrt{-x}\]
The parent equation of the given function is given as;
\[{{y}^{2}}=-x\]
Here,
\[{{y}^{2}}=-x\ge 0\]
The above equation represents the equation of the parabola.
Graph of \[{{y}^{2}}=-x\] is as follows;
Now,
The combined equation of \[{{y}^{2}}=-x\] representing the semi parabolas,
We have,
\[{{y}^{2}}=-x\]
Then,
\[y=\sqrt{-x}\] , where \[y\ge 0\]
The graph of the above equation representing the semi parabola is as follows;
And,
\[y=-\sqrt{-x}\] , where \[y\le 0\]
The graph of the above equation representing the semi parabola is as follows;
Thus,
The parent equation \[{{y}^{2}}=-x\] where \[{{y}^{2}}=-x\ge 0\] is the equation of the parabola or representing the parabola and it is the combined equation for the two semi parabolas i.e. the combined equation for the pair \[y=\sqrt{-x}\] where \[y\ge 0\] and \[y=-\sqrt{-x}\] , where \[y\le 0\] .
Note: In such types of questions, most of the students do mistakes while drawing the graph. First we need to find the range and the domain of the function. Then draw the graph of a parent equation i.e. parent graph as every function has their parent function there is only that the graph undergo transformation according to the function i.e. they are known as child function as they are only used to add elements to the parent function.

Recently Updated Pages
Basicity of sulphurous acid and sulphuric acid are
Master Class 8 Social Science: Engaging Questions & Answers for Success
Master Class 8 Science: Engaging Questions & Answers for Success
Master Class 8 Maths: Engaging Questions & Answers for Success
Class 8 Question and Answer - Your Ultimate Solutions Guide
Master Class 11 Business Studies: Engaging Questions & Answers for Success
Trending doubts
What are gulf countries and why they are called Gulf class 8 social science CBSE
What is BLO What is the full form of BLO class 8 social science CBSE
What are the 12 elements of nature class 8 chemistry CBSE
In Indian rupees 1 trillion is equal to how many c class 8 maths CBSE
Who created the image of Bharat Mata for the first class 8 social science CBSE
What is the Balkan issue in brief class 8 social science CBSE