


How do you graph $y=\sec \left( \dfrac{x}{2} \right)$?
Answer
603.6k+ views
Hint:We explain the main function of the given equation $y=\sec \left( \dfrac{x}{2} \right)$. We take the general equation and explain the amplitude, period. Then we equate the given function $y=\sec\left( \dfrac{x}{2} \right)$ with the general one and find the graph.
Complete step by step solution:
We need to find the amplitude, period for $y=\sec \left( \dfrac{x}{2} \right)$.
The main function of the given equation is $\sec x$. The period of $\cos x$ is $2\pi $.
We define the general formula to explain the amplitude, period for $\sec x$.
The $\sec x$ changes to $A\sec \left[ B\left( x+C \right) \right]+D$, the amplitude and the period becomes $\left| A \right|$ and $\dfrac{2\pi }{\left| B \right|}$.
Now we explain the things for the given $y=\sec \left( \dfrac{x}{2} \right)$.
$y=\sec \left( \dfrac{x}{2} \right)=1\times \sec \left[ \dfrac{1}{2}\times x \right]$. We equate with $A\sec \left[ B\left( x+C \right) \right]+D$.
The values will be \[\left| A \right|=1;\left| B \right|=\dfrac{1}{2}\]. The period is $\dfrac{2\pi}{\dfrac{1}{2}}=2\pi \times 2=4\pi $.
Therefore, the amplitude and period for $y=\sec \left( \dfrac{x}{2} \right)$ is $1,4\pi $ respectively.
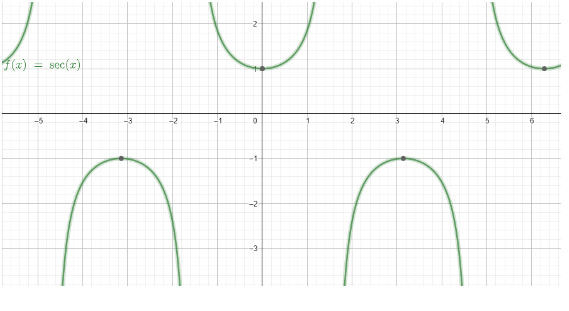
The usual common graph which is easier to plot on the graph is $y=\sec x$.
The graph is an oscillating graph with boundary being $\left( -\infty ,-1 \right)$ and $\left( 1,\infty\right)$.
The domain for the graph $y=\sec x$ is $\mathbb{R}$.
The range for the graph $y=\sec x$ is $\mathbb{R}\backslash \left( -1,1 \right)$.
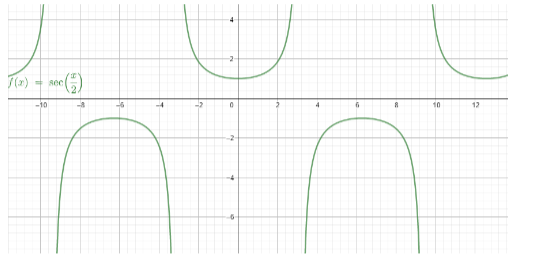
Now depending on the above-mentioned graph, we are going to first find the graph of
$y=\sec \left( \dfrac{x}{2} \right)$.
The change between $y=\sec x$ and $y=\sec \left( \dfrac{x}{2} \right)$ is that the graph is now stretched for twice its previous area.
The domain for the graph $y=\sec \left( \dfrac{x}{2} \right)$ is $\mathbb{R}$.
The range for the graph $y=\sec \left( \dfrac{x}{2} \right)$ is $\mathbb{R}\backslash \left( -1,1 \right)$.
Note: Amplitude is the vertical distance from the X-axis to the highest (or lowest) point on a sin or cosine curve. Period of each generalized sine or cosine curve is the length of one complete cycle. The previous graphs were oscillating for an area of $\pi $ and now it’s for $2\pi $.
Complete step by step solution:
We need to find the amplitude, period for $y=\sec \left( \dfrac{x}{2} \right)$.
The main function of the given equation is $\sec x$. The period of $\cos x$ is $2\pi $.
We define the general formula to explain the amplitude, period for $\sec x$.
The $\sec x$ changes to $A\sec \left[ B\left( x+C \right) \right]+D$, the amplitude and the period becomes $\left| A \right|$ and $\dfrac{2\pi }{\left| B \right|}$.
Now we explain the things for the given $y=\sec \left( \dfrac{x}{2} \right)$.
$y=\sec \left( \dfrac{x}{2} \right)=1\times \sec \left[ \dfrac{1}{2}\times x \right]$. We equate with $A\sec \left[ B\left( x+C \right) \right]+D$.
The values will be \[\left| A \right|=1;\left| B \right|=\dfrac{1}{2}\]. The period is $\dfrac{2\pi}{\dfrac{1}{2}}=2\pi \times 2=4\pi $.
Therefore, the amplitude and period for $y=\sec \left( \dfrac{x}{2} \right)$ is $1,4\pi $ respectively.
The usual common graph which is easier to plot on the graph is $y=\sec x$.
The graph is an oscillating graph with boundary being $\left( -\infty ,-1 \right)$ and $\left( 1,\infty\right)$.
The domain for the graph $y=\sec x$ is $\mathbb{R}$.
The range for the graph $y=\sec x$ is $\mathbb{R}\backslash \left( -1,1 \right)$.
Now depending on the above-mentioned graph, we are going to first find the graph of
$y=\sec \left( \dfrac{x}{2} \right)$.
The change between $y=\sec x$ and $y=\sec \left( \dfrac{x}{2} \right)$ is that the graph is now stretched for twice its previous area.
The domain for the graph $y=\sec \left( \dfrac{x}{2} \right)$ is $\mathbb{R}$.
The range for the graph $y=\sec \left( \dfrac{x}{2} \right)$ is $\mathbb{R}\backslash \left( -1,1 \right)$.
Note: Amplitude is the vertical distance from the X-axis to the highest (or lowest) point on a sin or cosine curve. Period of each generalized sine or cosine curve is the length of one complete cycle. The previous graphs were oscillating for an area of $\pi $ and now it’s for $2\pi $.
Recently Updated Pages
Master Class 11 English: Engaging Questions & Answers for Success
Master Class 11 Physics: Engaging Questions & Answers for Success
Master Class 11 Computer Science: Engaging Questions & Answers for Success
Master Class 11 Chemistry: Engaging Questions & Answers for Success
Master Class 11 Social Science: Engaging Questions & Answers for Success
Master Class 11 Accountancy: Engaging Questions & Answers for Success
Trending doubts
Difference Between Prokaryotic Cells and Eukaryotic Cells
Two of the body parts which do not appear in MRI are class 11 biology CBSE
One Metric ton is equal to kg A 10000 B 1000 C 100 class 11 physics CBSE
10 examples of friction in our daily life
Draw a diagram of nephron and explain its structur class 11 biology CBSE
Draw a diagram of a plant cell and label at least eight class 11 biology CBSE