


How do you graph \[y=\dfrac{1}{2}x-5\] by plotting points?
Answer
562.8k+ views
Hint: We are asked to draw the graph of the equation \[y=\dfrac{1}{2}x-5\]. The degree of an equation is the highest power of the variable present in it. So, as for this equation, the highest power present \[x\]is 1, the degree is also 1. From this, it can be said that this is a linear equation. The graph of a linear equation represents a straight line.
Complete step by step solution:
The general equation of a straight line is \[ax+by+c=0\], where \[a,b,c\]are any real numbers. The given equation is \[y=\dfrac{1}{2}x-5\], the equation can also be written as \[\dfrac{1}{2}x-y-5=0\], comparing with the general equation of straight line, we get \[a=\dfrac{1}{2},b=-1\And c=-5\].
To plot the graph of an equation of the straight line, we should know at least two points, through which the line passes.
To make things simple, let’s take the X-intercept and Y-intercept as the two points. X-intercept is the point where the line crosses X-axis, this means that the Y-coordinate will be \[0\], similarly Y-intercept is the point where the line crosses Y-axis, so X-coordinate will be \[0\]. We will use this property now.
We substitute \[y=0\] in the equation \[\dfrac{1}{2}x-y-5=0\], we get
\[\begin{align}
& \Rightarrow \dfrac{1}{2}x-0-5=0 \\
& \Rightarrow \dfrac{1}{2}x-5=0 \\
\end{align}\]
Solving the above equation, we get
\[\Rightarrow x=10\]
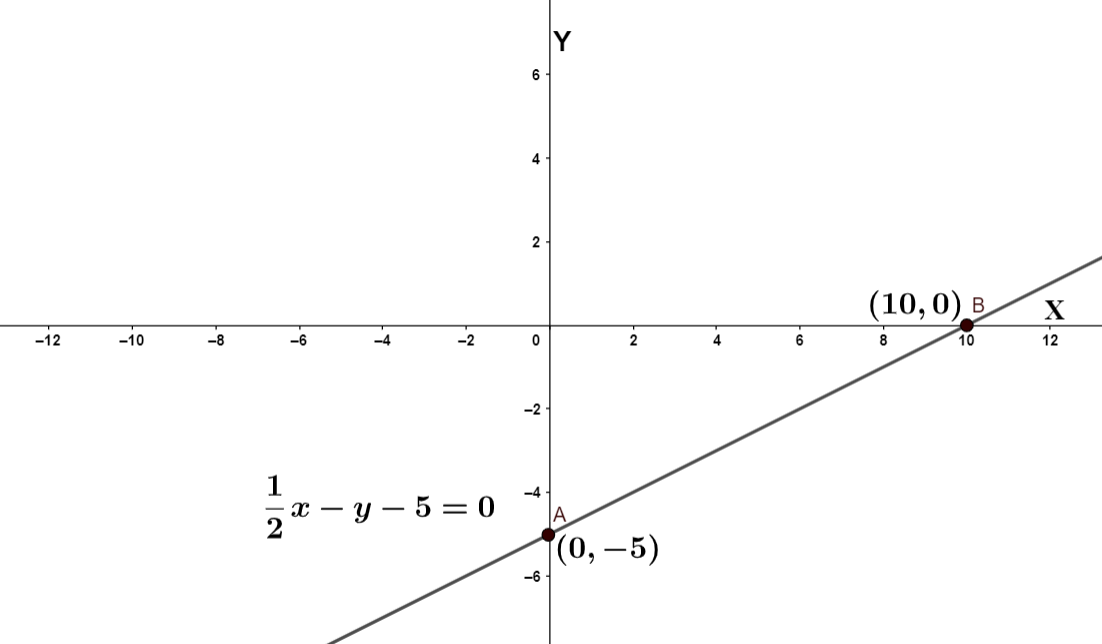
So, the coordinates of the X-intercept are \[\left( 10,0 \right)\].
Similarly, now we substitute \[x=0\]in the equation \[\dfrac{1}{2}x-y-5=0\], we get
\[\begin{align}
& \Rightarrow \dfrac{1}{2}(0)-y-5=0 \\
& \Rightarrow -y-5=0 \\
\end{align}\]
Adding \[y\]to both sides of the equation, we get
\[\begin{align}
& \Rightarrow -y-5+y=y \\
& \therefore y=-5 \\
\end{align}\]
So, the coordinates of the Y-intercept are \[(0,-5)\].
Using these two points we can plot the graph of the equation as follows:
Note:
Here, we found the two points which are X-intercept and Y-intercept by substituting either-or \[y\], one at a time. We can also find these values by converting the straight-line equation to the equation in intercept form which is, \[\dfrac{x}{a}+\dfrac{y}{b}=1\]. Here, \[a\] and \[b\] are X-intercept and Y-intercept respectively.
Complete step by step solution:
The general equation of a straight line is \[ax+by+c=0\], where \[a,b,c\]are any real numbers. The given equation is \[y=\dfrac{1}{2}x-5\], the equation can also be written as \[\dfrac{1}{2}x-y-5=0\], comparing with the general equation of straight line, we get \[a=\dfrac{1}{2},b=-1\And c=-5\].
To plot the graph of an equation of the straight line, we should know at least two points, through which the line passes.
To make things simple, let’s take the X-intercept and Y-intercept as the two points. X-intercept is the point where the line crosses X-axis, this means that the Y-coordinate will be \[0\], similarly Y-intercept is the point where the line crosses Y-axis, so X-coordinate will be \[0\]. We will use this property now.
We substitute \[y=0\] in the equation \[\dfrac{1}{2}x-y-5=0\], we get
\[\begin{align}
& \Rightarrow \dfrac{1}{2}x-0-5=0 \\
& \Rightarrow \dfrac{1}{2}x-5=0 \\
\end{align}\]
Solving the above equation, we get
\[\Rightarrow x=10\]
So, the coordinates of the X-intercept are \[\left( 10,0 \right)\].
Similarly, now we substitute \[x=0\]in the equation \[\dfrac{1}{2}x-y-5=0\], we get
\[\begin{align}
& \Rightarrow \dfrac{1}{2}(0)-y-5=0 \\
& \Rightarrow -y-5=0 \\
\end{align}\]
Adding \[y\]to both sides of the equation, we get
\[\begin{align}
& \Rightarrow -y-5+y=y \\
& \therefore y=-5 \\
\end{align}\]
So, the coordinates of the Y-intercept are \[(0,-5)\].
Using these two points we can plot the graph of the equation as follows:
Note:
Here, we found the two points which are X-intercept and Y-intercept by substituting either-or \[y\], one at a time. We can also find these values by converting the straight-line equation to the equation in intercept form which is, \[\dfrac{x}{a}+\dfrac{y}{b}=1\]. Here, \[a\] and \[b\] are X-intercept and Y-intercept respectively.
Recently Updated Pages
Basicity of sulphurous acid and sulphuric acid are
Master Class 11 Business Studies: Engaging Questions & Answers for Success
Master Class 11 Computer Science: Engaging Questions & Answers for Success
Master Class 11 Economics: Engaging Questions & Answers for Success
Master Class 11 Social Science: Engaging Questions & Answers for Success
Master Class 11 English: Engaging Questions & Answers for Success
Trending doubts
One Metric ton is equal to kg A 10000 B 1000 C 100 class 11 physics CBSE
The largest wind power cluster is located in the state class 11 social science CBSE
Explain zero factorial class 11 maths CBSE
State and prove Bernoullis theorem class 11 physics CBSE
What steps did the French revolutionaries take to create class 11 social science CBSE
Which among the following are examples of coming together class 11 social science CBSE