


How do you graph the equation by plotting points \[y + 2 = 0\]
Answer
570k+ views
Hint: We write the given equation of line by writing the coefficient of the x-axis as 0. Substitute the value of points one by one after attaining the equation or value of y in terms of x. Put different values of x and find values of y.
* General equation of line in x-y plane is given by \[Ax + By + C = 0\]
Complete step-by-step answer:
We are given the equation \[y + 2 = 0\]
We see that there is no x-variable present in the equation, so we can say the x-coordinate is 0 here.
Also, we can write the equation as \[0.x + y + 2 = 0\]
Now we will shift the values except y to right side of the equation such that we obtain the value of y in terms of x
Shift all values except y to RHS of the equation
\[ \Rightarrow y = - 2 - 0.x\] … (1)
Now we substitute some values of x and calculate the respective values of y.
Put \[x = 0\] then we get \[y = - 2\]
Put \[x = 1\] then we get \[y = - 2\]
Put \[x = 2\] then we get \[y = - 2\] and so on
We can see that be any value of ‘x’, we always get the value of y as -2
Now we plot some points on the graph so we can plot the graph of the equation
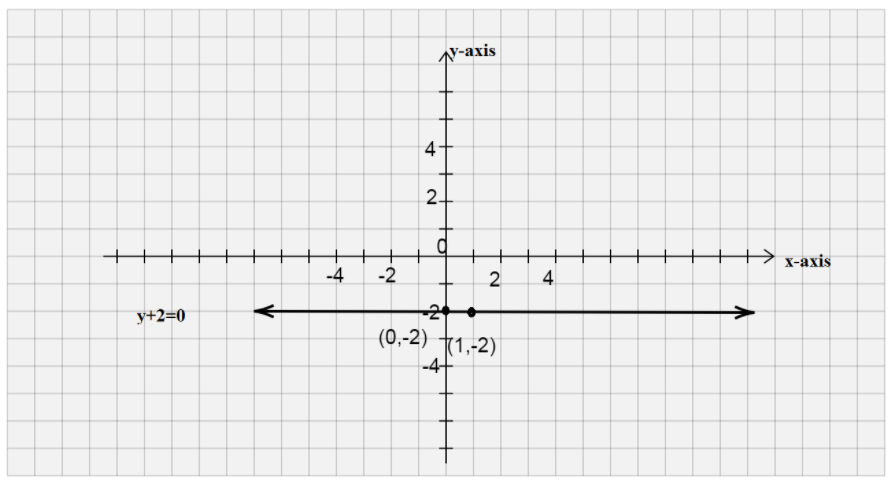
Plot points \[A(0, - 2);B(1, - 2);C(2, - 2)\]
The line formed by joining the points will be \[y + 2 = 0\]. The line is marked as a bold line in the graph.
Note:
Many students make the mistake of assuming the coefficient of x as 1 and then find the values of y and x accordingly which is wrong. Keep in mind the variable which is not present in the equation means that we have the coefficient of that variable as 0.
* General equation of line in x-y plane is given by \[Ax + By + C = 0\]
Complete step-by-step answer:
We are given the equation \[y + 2 = 0\]
We see that there is no x-variable present in the equation, so we can say the x-coordinate is 0 here.
Also, we can write the equation as \[0.x + y + 2 = 0\]
Now we will shift the values except y to right side of the equation such that we obtain the value of y in terms of x
Shift all values except y to RHS of the equation
\[ \Rightarrow y = - 2 - 0.x\] … (1)
Now we substitute some values of x and calculate the respective values of y.
Put \[x = 0\] then we get \[y = - 2\]
Put \[x = 1\] then we get \[y = - 2\]
Put \[x = 2\] then we get \[y = - 2\] and so on
We can see that be any value of ‘x’, we always get the value of y as -2
Now we plot some points on the graph so we can plot the graph of the equation
Plot points \[A(0, - 2);B(1, - 2);C(2, - 2)\]
The line formed by joining the points will be \[y + 2 = 0\]. The line is marked as a bold line in the graph.
Note:
Many students make the mistake of assuming the coefficient of x as 1 and then find the values of y and x accordingly which is wrong. Keep in mind the variable which is not present in the equation means that we have the coefficient of that variable as 0.

Recently Updated Pages
Basicity of sulphurous acid and sulphuric acid are
Master Class 11 Business Studies: Engaging Questions & Answers for Success
Master Class 11 Computer Science: Engaging Questions & Answers for Success
Master Class 11 Economics: Engaging Questions & Answers for Success
Master Class 12 English: Engaging Questions & Answers for Success
Master Class 12 Social Science: Engaging Questions & Answers for Success
Trending doubts
Fill the blanks with the suitable prepositions 1 The class 9 english CBSE
Difference Between Plant Cell and Animal Cell
What is the color of ferrous sulphate crystals? How does this color change after heating? Name the products formed on strongly heating ferrous sulphate crystals. What type of chemical reaction occurs in this type of change.
What is the Full Form of ICSE / ISC ?
What is pollution? How many types of pollution? Define it
Explain the importance of pH in everyday life class 9 chemistry CBSE
Fill the blanks with the suitable prepositions 1 The class 9 english CBSE
Difference Between Plant Cell and Animal Cell
What is the color of ferrous sulphate crystals? How does this color change after heating? Name the products formed on strongly heating ferrous sulphate crystals. What type of chemical reaction occurs in this type of change.