


For which model the percentage rise/fall in production from $ 2000 $ to $ 2001 $ was minimum?
(A) Q
(B) R
(C) S
(D) T
Answer
581.4k+ views
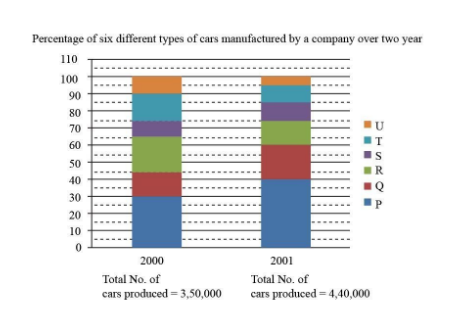
Hint: This question is based on Data Interpretation and in this question, two models showing the percentage rise/fall in production from year $ 2000 $ to $ 2001 $ are given. The production of different cars is shown in the model using different colors assigned to their respective letters.
The formula used to calculate the percentage rise/fall in production from $ 2000 $ to $ 2001 $ is given by-
$ {\text{Percent rise/fall in production = }}\dfrac{{{\text{Production in 2000 }} \pm {\text{ Production in 2001}}}}{{{\text{Production in 2000}}}} \times 100 $
Complete step-by-step answer:
Given:
Total number of cars produced in year 2000 $ = 3,50,000 $
And, total number of cars produced in year 2001 $ = 4,40,000 $
Also, the types of cars manufactured by a company $ = 6 $
These different types of cars manufactured by a company are U, T, S, R, Q and P, respectively.
Now, by observing the model given, we have,
For year 2000,
$\Rightarrow$ Number of U type of cars produced in year 2000
$
= \left( {100 - 90} \right)\% {\text{ of Total cars produced in 2000}}\\
{\text{ = }}\dfrac{{10}}{{100}} \times 350000\\
= 35000
$
Similarly,
$\Rightarrow$ Number of T type of cars produced in year 2000
$
= \left( {90 - 75} \right)\% {\text{ of 350000}}\\
{\text{ = }}\dfrac{{15}}{{100}} \times 350000\\
= 52500
$
$\Rightarrow$ Number of S type of cars produced in year 2000
$
= \left( {75 - 65} \right)\% {\text{ of 350000}}\\
{\text{ = }}\dfrac{{10}}{{100}} \times 350000\\
= 35000
$
$\Rightarrow$ Number of R type of cars produced in year 2000
$
= \left( {64 - 45} \right)\% {\text{ of 350000}}\\
{\text{ = }}\dfrac{{20}}{{100}} \times 350000\\
= 70000
$
$\Rightarrow$ Number of Q type of cars produced in year 2000
\[
= \left( {45 - 30} \right)\% {\text{ of 350000}}\\
{\text{ = }}\dfrac{{15}}{{100}} \times 350000\\
= 52500
\]
$\Rightarrow$ Number of P type of cars produced in year 2000
$
= \left( {30 - 0} \right)\% {\text{ of 350000}}\\
{\text{ = }}\dfrac{{30}}{{100}} \times 350000\\
= 105000
$
For year 2001,
$\Rightarrow$ Number of U type of cars produced in year 2001
$
= \left( {100 - 95} \right)\% {\text{ of Total cars produced in 2001}}\\
{\text{ = }}\dfrac{5}{{100}} \times 440000\\
= 22000
$
Similarly,
$\Rightarrow$ Number of T type of cars produced in year 2001
$
= \left( {95 - 85} \right)\% {\text{ of Total cars produced in 2001}}\\
{\text{ = }}\dfrac{{10}}{{100}} \times 440000\\
= 44000
$
$\Rightarrow$ Number of S type of cars produced in year 2001
$
= \left( {85 - 75} \right)\% {\text{ of Total cars produced in 2001}}\\
{\text{ = }}\dfrac{{10}}{{100}} \times 440000\\
= 44000
$
$\Rightarrow$ Number of R type of cars produced in year 2001
$
= \left( {75 - 60} \right)\% {\text{ of Total cars produced in 2001}}\\
{\text{ = }}\dfrac{{15}}{{100}} \times 440000\\
= 66000
$
$\Rightarrow$ Number of Q type of cars produced in year 2001
$
= \left( {60 - 40} \right)\% {\text{ of Total cars produced in 2001}}\\
{\text{ = }}\dfrac{{20}}{{100}} \times 440000\\
= 88000
$
$\Rightarrow$ Number of P type of cars produced in year 2001
$
= \left( {40 - 0} \right)\% {\text{ of Total cars produced in 2001}}\\
{\text{ = }}\dfrac{{40}}{{100}} \times 440000\\
= 176000
$
Now comparing the number of the cars produced in year 2000 and 2001, we get,
$\Rightarrow$ Fall in the production of U type of cars
\[
= 35000 - 22000\\
= 13000
\]
$\Rightarrow$ Percent fall in the production of U types of cars $
= \dfrac{{13000}}{{{\text{Number of U type of cars produced in year 2000}}}} \times 100\\
= \dfrac{{13000}}{{35000}} \times 100\\
= 37.14\%
$
Similarly,
$\Rightarrow$ Fall in the production of T type of cars
$
= 52500 - 44000\\
= 8500
$
$\Rightarrow$ Percent fall in the production of T types of cars
$
= \dfrac{{8500}}{{52500}} \times 100\\
= 16.19\%
$
$\Rightarrow$ Rise in the production of S type of cars
$
= 44000 - 35000\\
= 9000
$
$\Rightarrow$ Percent rise in the production of S types of cars
$
= \dfrac{{9000}}{{35000}} \times 100\\
= 25.71\%
$
$\Rightarrow$ Fall in the production of R type of cars
$
= 70000 - 66000\\
= 4000
$
$\Rightarrow$ Percent fall in the production of R types of cars
$
= \dfrac{{4000}}{{70000}} \times 100\\
= 5.71\%
$
$\Rightarrow$ Rise in the production of Q type of cars
$
= 88000 - 52500\\
= 35500
$
$\Rightarrow$ Percent rise in the production of Q types of cars
$
= \dfrac{{35500}}{{52500}} \times 100\\
= 67.62\%
$
$\Rightarrow$ Rise in the production of P type of cars
$
= 176000 - 105000\\
= 71000
$
$\Rightarrow$ Percent rise in the production of P types of cars
$
= \dfrac{{71000}}{{105000}} \times 100\\
= 67.62\%
$
Therefore, the percentage fall in production from $ 2000 $ to $ 2001 $ is minimum for “model R” and the correct option is (B).
So, the correct answer is “Option B”.
Note: We cannot simply deduce the answer by looking at the graphs for the respective years because the number of cars manufactured in the year 2000 is completely different from the number of cars manufactured in the year 2001. That is why we need to find the number of cars for each model in a year and then compare them with the number of cars for another year.
Recently Updated Pages
Master Class 9 General Knowledge: Engaging Questions & Answers for Success
Master Class 9 Social Science: Engaging Questions & Answers for Success
Master Class 9 English: Engaging Questions & Answers for Success
Master Class 9 Maths: Engaging Questions & Answers for Success
Master Class 9 Science: Engaging Questions & Answers for Success
Class 9 Question and Answer - Your Ultimate Solutions Guide
Trending doubts
Difference Between Plant Cell and Animal Cell
Fill the blanks with the suitable prepositions 1 The class 9 english CBSE
Who is eligible for RTE class 9 social science CBSE
Which places in India experience sunrise first and class 9 social science CBSE
What is pollution? How many types of pollution? Define it
Name 10 Living and Non living things class 9 biology CBSE