


Draw the graph of straight line $y=x-3$.
Answer
623.4k+ views
Hint: We will first start by using a fact that a line of form $y=mx+c$ is a straight line. Then we will use the basic plotting technique of finding x and y values which satisfies the curve and use the same for plotting on the Cartesian plane.
Complete step-by-step answer:
Now, we have to draw the graph of the straight line $y=x-3$.
Now, we know that the slope intercept form equation of a straight line is $y=mx+c$ and its graph is,
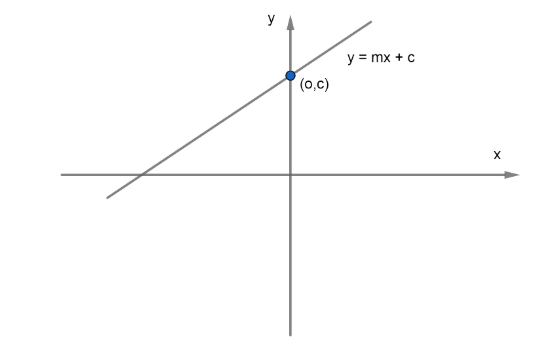
Now, we have to draw the graph of $y=x-3$ which is similar to $y=mx+c$.
Now, we have for different values of x the different values which satisfy the curve $y=x-3$ as $\left( 0,-3 \right),\left( 3,0 \right)$.
Now, we plot the points on the Cartesian plane and go to them.
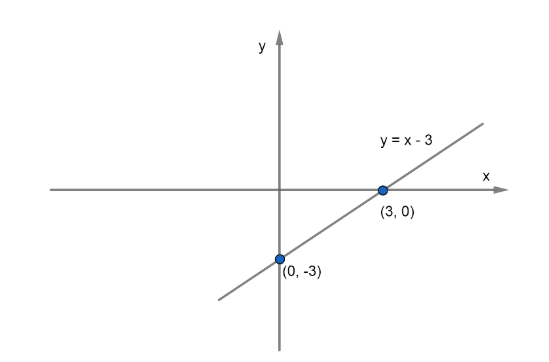
So, we have the graph of $y=x-3$ as above.
Note:It is important to note that we have used the fact that the slope – intercept form of line is $y=mx+c$. Also, we have plot two points which satisfy $y=x-3$ and join them to draw the graph of $y=x-3$ as we know that a unique passes through two points.
Complete step-by-step answer:
Now, we have to draw the graph of the straight line $y=x-3$.
Now, we know that the slope intercept form equation of a straight line is $y=mx+c$ and its graph is,
Now, we have to draw the graph of $y=x-3$ which is similar to $y=mx+c$.
Now, we have for different values of x the different values which satisfy the curve $y=x-3$ as $\left( 0,-3 \right),\left( 3,0 \right)$.
Now, we plot the points on the Cartesian plane and go to them.
So, we have the graph of $y=x-3$ as above.
Note:It is important to note that we have used the fact that the slope – intercept form of line is $y=mx+c$. Also, we have plot two points which satisfy $y=x-3$ and join them to draw the graph of $y=x-3$ as we know that a unique passes through two points.

Recently Updated Pages
Master Class 8 Social Science: Engaging Questions & Answers for Success
Master Class 8 Science: Engaging Questions & Answers for Success
Master Class 8 Maths: Engaging Questions & Answers for Success
Class 8 Question and Answer - Your Ultimate Solutions Guide
Master Class 9 Social Science: Engaging Questions & Answers for Success
Master Class 9 Science: Engaging Questions & Answers for Success
Trending doubts
What are gulf countries and why they are called Gulf class 8 social science CBSE
What is BLO What is the full form of BLO class 8 social science CBSE
Give full form of LPG and CNG class 8 chemistry CBSE
Citizens of India can vote at the age of A 18 years class 8 social science CBSE
Advantages and disadvantages of science
Full form of STD, ISD and PCO