


Draw a phasor diagram to represent the current and supply voltage appropriately as phasors. State the phase difference between the two quantities.
Answer
617.1k+ views
Hint: To draw the phasor diagram, we have to find the phase difference first. Use the formula for alternating voltage and alternating current. For voltage, at $t=\dfrac { T }{ 4 }$, $V ={V}+{0}$, substitute this value in the formula for alternating voltage and find the frequency. Similarly for current, At $t=\dfrac { T }{ 8 }$, $I ={I}_{0}$, substitute the value in alternating current formula. Now, substitute the value of obtained frequency in the formula for alternating current. Solve the obtained equation and find the phase difference.
Formula used:
$V={ V }_{ 0 }\sin { \left( \omega t \right) }$
$I= { I }_{ 0 }\sin { \left( \omega t+\phi \right) }$
Complete answer:
Let the phase difference be $\phi$.
From the figure given, we can infer that the voltage is lagging the current by a phase difference $\phi$.
Alternating voltage is given by,
$V={ V }_{ 0 }\sin { \left( \omega t \right) }$ …(1)
Alternating current is given by,
$I= { I }_{ 0 }\sin { \left( \omega t+\phi \right) }$ …(2)
At $t=\dfrac { T }{ 4 }$, $V ={V}_{0}$
Substituting this value in the equation. (1) we get,
$ V=V\sin { \left( \dfrac { \omega T }{ 4 } \right) }$
$\Rightarrow 1=\sin { \left( \dfrac { \omega T }{ 4 } \right) }$
$\Rightarrow \dfrac { \omega T }{ 4 } =\quad \dfrac { \pi }{ 2 }$
$\Rightarrow \omega =\cfrac { 2\pi }{ T }$ …(3)
Similarly, at $t=\dfrac { T }{ 8 }$, $I ={I}_{0}$
Substituting this value in the equation. (2) we get,
$I=I\sin { \left( \omega t+\phi \right) }$
$\Rightarrow 1=\sin { \left( \dfrac { \omega T }{ 8 } + \phi \right) }$ …(2)
Substituting equation. (3) in equation. (4) we get,
$\sin { \left( \dfrac { 2\pi }{ T } \times \dfrac { T }{ 8 } + \phi \right) } =\quad 1$
$\Rightarrow \sin { \left( \cfrac { \pi }{ 4 } +\phi \right) } =\quad 1$
$\Rightarrow \cfrac { \pi }{ 4 } +\phi =\cfrac { \pi }{ 2 }$
$\Rightarrow \phi =\cfrac { \pi }{ 2 }$
$\Rightarrow \phi=45°$
So, the corresponding phasor diagram can be drawn as given below,
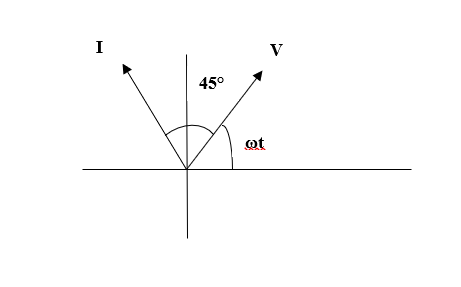
So, the phase difference between current and voltage is 45°.
Note:
Phasor diagrams are used to do mathematical operations such as addition, subtraction, multiplication etc. The calculation can include any common values such as RMS, peak values etc. Students should not get confused between vector and phasor. Vector illustrates quantity and direction whereas phasor illustrates quantity and displacement. Phasor is a rotating vector. It is very difficult to represent the relation between current and voltage using a graph, hence phasor diagrams are used.
Formula used:
$V={ V }_{ 0 }\sin { \left( \omega t \right) }$
$I= { I }_{ 0 }\sin { \left( \omega t+\phi \right) }$
Complete answer:
Let the phase difference be $\phi$.
From the figure given, we can infer that the voltage is lagging the current by a phase difference $\phi$.
Alternating voltage is given by,
$V={ V }_{ 0 }\sin { \left( \omega t \right) }$ …(1)
Alternating current is given by,
$I= { I }_{ 0 }\sin { \left( \omega t+\phi \right) }$ …(2)
At $t=\dfrac { T }{ 4 }$, $V ={V}_{0}$
Substituting this value in the equation. (1) we get,
$ V=V\sin { \left( \dfrac { \omega T }{ 4 } \right) }$
$\Rightarrow 1=\sin { \left( \dfrac { \omega T }{ 4 } \right) }$
$\Rightarrow \dfrac { \omega T }{ 4 } =\quad \dfrac { \pi }{ 2 }$
$\Rightarrow \omega =\cfrac { 2\pi }{ T }$ …(3)
Similarly, at $t=\dfrac { T }{ 8 }$, $I ={I}_{0}$
Substituting this value in the equation. (2) we get,
$I=I\sin { \left( \omega t+\phi \right) }$
$\Rightarrow 1=\sin { \left( \dfrac { \omega T }{ 8 } + \phi \right) }$ …(2)
Substituting equation. (3) in equation. (4) we get,
$\sin { \left( \dfrac { 2\pi }{ T } \times \dfrac { T }{ 8 } + \phi \right) } =\quad 1$
$\Rightarrow \sin { \left( \cfrac { \pi }{ 4 } +\phi \right) } =\quad 1$
$\Rightarrow \cfrac { \pi }{ 4 } +\phi =\cfrac { \pi }{ 2 }$
$\Rightarrow \phi =\cfrac { \pi }{ 2 }$
$\Rightarrow \phi=45°$
So, the corresponding phasor diagram can be drawn as given below,
So, the phase difference between current and voltage is 45°.
Note:
Phasor diagrams are used to do mathematical operations such as addition, subtraction, multiplication etc. The calculation can include any common values such as RMS, peak values etc. Students should not get confused between vector and phasor. Vector illustrates quantity and direction whereas phasor illustrates quantity and displacement. Phasor is a rotating vector. It is very difficult to represent the relation between current and voltage using a graph, hence phasor diagrams are used.
Recently Updated Pages
Master Class 12 Business Studies: Engaging Questions & Answers for Success
Master Class 12 Chemistry: Engaging Questions & Answers for Success
Master Class 12 Biology: Engaging Questions & Answers for Success
Class 12 Question and Answer - Your Ultimate Solutions Guide
Master Class 11 English: Engaging Questions & Answers for Success
Master Class 11 Social Science: Engaging Questions & Answers for Success
Trending doubts
Which are the Top 10 Largest Countries of the World?
Draw a labelled sketch of the human eye class 12 physics CBSE
Differentiate between homogeneous and heterogeneous class 12 chemistry CBSE
In order to find out the different types of gametes class 12 biology NEET_UG
Why is the cell called the structural and functional class 12 biology CBSE
Draw ray diagrams each showing i myopic eye and ii class 12 physics CBSE