


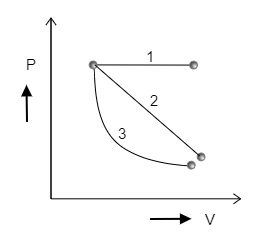
Determine for which of the following three P-V diagrams shown in the figure is the work done the minimum.
A) 1
B) 2
C) 3
D) Cannot be determined.
Answer
594.9k+ views
Hint: In a graph between the pressure of the gas and the volume of the gas, the area under the curve which represents the transition of the gas from one state to another will determine the work done by the gas. So a smaller area under the curve will indicate that lesser work is done to attain the transition of the gas.
Complete step by step answer:
Step 1: Sketching each curve individually and marking the area under the curves to determine which curve involves minimum work.
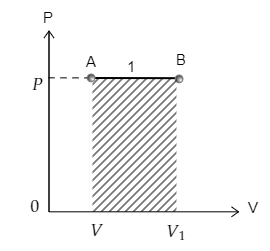
The curve 1 depicting the transition from point A to point B is sketched below. The area under the curve 1 is also marked. The pressure at A is $P$ and volume is $V$ while the pressure and volume at B are ${P_1} = P$ and ${V_1}$ respectively.
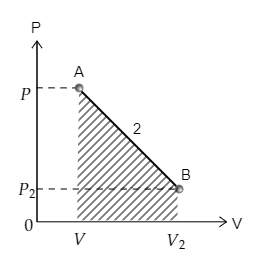
Now the curve 2 depicting the transition from point A to point B is sketched below. The area under the curve 2 is also marked. The pressure at A is $P$ and volume is $V$ while the pressure and volume at B are ${P_2}$ and ${V_2}$ respectively.
Finally, curve 3 depicting the transition from point A to point B is sketched below. The area under the curve 3 is also marked. The pressure at A is $P$ and volume is $V$ while the pressure and volume at B are ${P_3}$ and ${V_3}$ respectively.
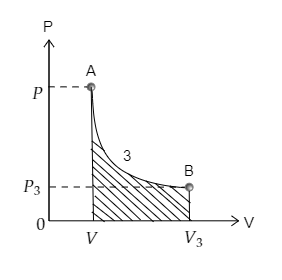
Now on observing the areas under each curve we realize that the area under curve 3 is minimum. Then the work done will also be minimum for curve 3.
Therefore, the correct option is C.
Note:
The work done by the gas depends on the change in the volume $V$ and the change in the pressure $P$ of the gas as $W = \Delta \left( {PV} \right)$. The given curves depict an increase in the volume of the gas. For curve 1, the pressure remained constant as the volume increased. While for curve 2 and curve 3, the pressure dropped with the increase in volume. Curve 1 describes an isobaric process as the pressure remained constant.
Complete step by step answer:
Step 1: Sketching each curve individually and marking the area under the curves to determine which curve involves minimum work.
The curve 1 depicting the transition from point A to point B is sketched below. The area under the curve 1 is also marked. The pressure at A is $P$ and volume is $V$ while the pressure and volume at B are ${P_1} = P$ and ${V_1}$ respectively.
Now the curve 2 depicting the transition from point A to point B is sketched below. The area under the curve 2 is also marked. The pressure at A is $P$ and volume is $V$ while the pressure and volume at B are ${P_2}$ and ${V_2}$ respectively.
Finally, curve 3 depicting the transition from point A to point B is sketched below. The area under the curve 3 is also marked. The pressure at A is $P$ and volume is $V$ while the pressure and volume at B are ${P_3}$ and ${V_3}$ respectively.
Now on observing the areas under each curve we realize that the area under curve 3 is minimum. Then the work done will also be minimum for curve 3.
Therefore, the correct option is C.
Note:
The work done by the gas depends on the change in the volume $V$ and the change in the pressure $P$ of the gas as $W = \Delta \left( {PV} \right)$. The given curves depict an increase in the volume of the gas. For curve 1, the pressure remained constant as the volume increased. While for curve 2 and curve 3, the pressure dropped with the increase in volume. Curve 1 describes an isobaric process as the pressure remained constant.
Recently Updated Pages
Basicity of sulphurous acid and sulphuric acid are
Master Class 11 Business Studies: Engaging Questions & Answers for Success
Master Class 11 Computer Science: Engaging Questions & Answers for Success
Master Class 11 Economics: Engaging Questions & Answers for Success
Master Class 11 Social Science: Engaging Questions & Answers for Success
Master Class 11 English: Engaging Questions & Answers for Success
Trending doubts
One Metric ton is equal to kg A 10000 B 1000 C 100 class 11 physics CBSE
The largest wind power cluster is located in the state class 11 social science CBSE
Explain zero factorial class 11 maths CBSE
State and prove Bernoullis theorem class 11 physics CBSE
Which among the following are examples of coming together class 11 social science CBSE
Can anyone list 10 advantages and disadvantages of friction