


How do you create a table and graph the equation \[y=2x-1\]?
Answer
582.3k+ views
Hint: A straight line in the form \[y=mx+c\] has slope m and y-intercept c. We can graph any straight line using any two points lying on it. Now we have to find the points lying on the straight line and draw the graph.
As per the given question, we have to graph the given straight line by creating a table and plot the points.
Complete step by step answer:
To find the points we have to substitute some x values in the straight line then we get the value of y.
Let \[x=-2\] then the value of y is
\[\Rightarrow \]\[y=2x-1=2\left( -2 \right)-1=-4-1=-5\]
Now \[x=-1\] then the value of y is
\[\Rightarrow \]\[y=2x-1=2\left( -1 \right)-1=-2-1=-3\]
Now \[x=0\] then the value of y is
\[\Rightarrow \]\[y=2x-1=2\left( 0 \right)-1=0-1=-1\]
Now \[x=1\] then the value of y is
\[\Rightarrow \]\[y=2x-1=2\left( 1 \right)-1=2-1=1\]
Now \[x=1\] then the value of y is
\[\Rightarrow \]\[y=2x-1=2\left( 2 \right)-1=4-1=3\]
Now we draw a table and enter these points
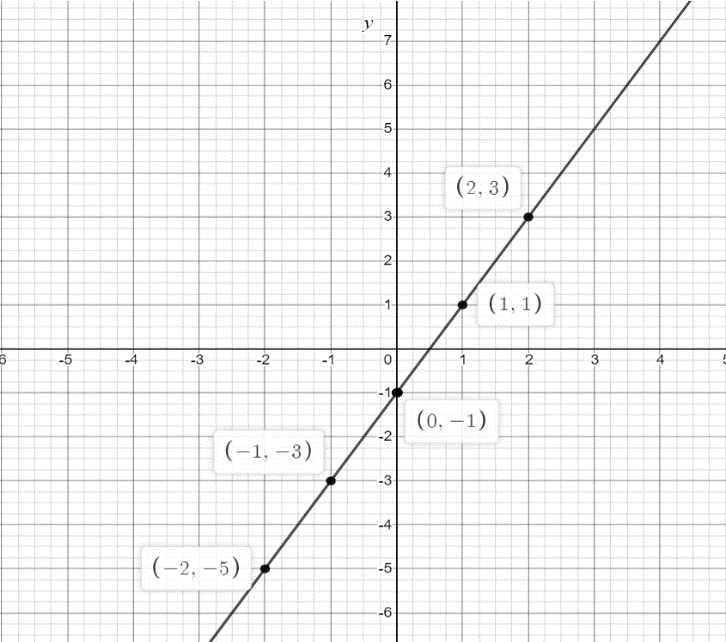
Now we plot these points on a graph and join them with a straight line.
The graph of \[y=2x-1\] is shown below:
Note: In order to solve these types of problems, we need to have knowledge over straight lines. We should know about how to graph a straight line. We can draw the graph of \[y=ax+b\] from the simple graph \[y=x\]. We need to modify the \[y=x\] graph by shifting and scaling methods. It is a better idea to modify the graph of \[y=x\] in such a manner that we get the required graph by going from left side to right side of the equation \[y=2x-1\]. We should avoid calculation mistakes to get the correct solution.
As per the given question, we have to graph the given straight line by creating a table and plot the points.
Complete step by step answer:
To find the points we have to substitute some x values in the straight line then we get the value of y.
Let \[x=-2\] then the value of y is
\[\Rightarrow \]\[y=2x-1=2\left( -2 \right)-1=-4-1=-5\]
Now \[x=-1\] then the value of y is
\[\Rightarrow \]\[y=2x-1=2\left( -1 \right)-1=-2-1=-3\]
Now \[x=0\] then the value of y is
\[\Rightarrow \]\[y=2x-1=2\left( 0 \right)-1=0-1=-1\]
Now \[x=1\] then the value of y is
\[\Rightarrow \]\[y=2x-1=2\left( 1 \right)-1=2-1=1\]
Now \[x=1\] then the value of y is
\[\Rightarrow \]\[y=2x-1=2\left( 2 \right)-1=4-1=3\]
Now we draw a table and enter these points
| x | y | \[\left( x,y \right)\] |
| -2 | -5 | \[\left( -2,-5 \right)\] |
| -1 | -3 | \[\left( -1,-3 \right)\] |
| 0 | -1 | \[\left( 0,-1 \right)\] |
| 1 | 1 | \[\left( 1,1 \right)\] |
| 2 | 3 | \[\left( 2,3 \right)\] |
Now we plot these points on a graph and join them with a straight line.
The graph of \[y=2x-1\] is shown below:
Note: In order to solve these types of problems, we need to have knowledge over straight lines. We should know about how to graph a straight line. We can draw the graph of \[y=ax+b\] from the simple graph \[y=x\]. We need to modify the \[y=x\] graph by shifting and scaling methods. It is a better idea to modify the graph of \[y=x\] in such a manner that we get the required graph by going from left side to right side of the equation \[y=2x-1\]. We should avoid calculation mistakes to get the correct solution.
Recently Updated Pages
Master Class 11 English: Engaging Questions & Answers for Success
Master Class 11 Maths: Engaging Questions & Answers for Success
Class 11 Question and Answer - Your Ultimate Solutions Guide
Master Class 11 Biology: Engaging Questions & Answers for Success
Master Class 11 Physics: Engaging Questions & Answers for Success
Master Class 11 Accountancy: Engaging Questions & Answers for Success
Trending doubts
Differentiate between an exothermic and an endothermic class 11 chemistry CBSE
One Metric ton is equal to kg A 10000 B 1000 C 100 class 11 physics CBSE
In what year Guru Nanak Dev ji was born A15 April 1469 class 11 social science CBSE
Difference Between Prokaryotic Cells and Eukaryotic Cells
There are 720 permutations of the digits 1 2 3 4 5 class 11 maths CBSE
Draw a diagram of a plant cell and label at least eight class 11 biology CBSE