


An oak tree produces thousands of acorns, but very few grow into mature oak trees. The oak tree exhibits a _______ survivorship curve.
A. type-I
B. type-II
C. type-III
D. type I or II
Answer
430.5k+ views
Hint: An acorn is basically a fruit because it contains a seed, but it is classified as a nut due to its hard outer covering. This nut is unique to trees in the Quercus genus, which is also known as oaks.
Complete step by step solution:
Oak trees produce acorns annually during the fall, but crop sizes vary widely based on a number of factors. Most oak trees begin to produce acorns around the age of 30 and stop producing after the age of 80.
The survivorship curve is a graphical representation of the number of people in a population who can be expected to live to a certain age.
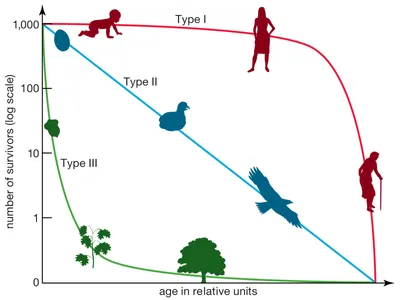
Curves are classified into three types. The Type I curve, as illustrated by large mammals, follows organisms that have a long lifespan (low death rate and high survivorship rate); however, near the end of their lives, there is a sharp rise in the death rate. The Type III curve, found in small mammals, fishes, and invertebrates, is the inverse: it characterizes organisms with a high rate of death (or low survivorship rate) shortly after birth. The Type II curve, on the other hand, takes into account birds, mice, and other organisms that have pretty consistent mortality or survivorship rate all through their life expectancies.
The Type-III curve is extremely concave. The survival rate is quite low in the early ages of the individuals in this type of survivorship and tends to increase comparatively later in their lives. Again, this indicates that their mortality rate is relatively high in their early lives and may decrease in their later lives. To compensate for this, these individuals have a large number of children. As a result, the children receive little parental attention. This is known as the r strategy of these individuals.
Hence, option C is correct
Note:
A type-III survivorship curve is found in some birds, black-tailed deer, oysters, and other shellfish, insects, and oak trees. Although we have discussed the three different types of survivorship curves, such clear demarcations do not exist in reality. Survivorship exists on a scale, with types I and III representing the extremes.
Complete step by step solution:
Oak trees produce acorns annually during the fall, but crop sizes vary widely based on a number of factors. Most oak trees begin to produce acorns around the age of 30 and stop producing after the age of 80.
The survivorship curve is a graphical representation of the number of people in a population who can be expected to live to a certain age.
Curves are classified into three types. The Type I curve, as illustrated by large mammals, follows organisms that have a long lifespan (low death rate and high survivorship rate); however, near the end of their lives, there is a sharp rise in the death rate. The Type III curve, found in small mammals, fishes, and invertebrates, is the inverse: it characterizes organisms with a high rate of death (or low survivorship rate) shortly after birth. The Type II curve, on the other hand, takes into account birds, mice, and other organisms that have pretty consistent mortality or survivorship rate all through their life expectancies.
The Type-III curve is extremely concave. The survival rate is quite low in the early ages of the individuals in this type of survivorship and tends to increase comparatively later in their lives. Again, this indicates that their mortality rate is relatively high in their early lives and may decrease in their later lives. To compensate for this, these individuals have a large number of children. As a result, the children receive little parental attention. This is known as the r strategy of these individuals.
Hence, option C is correct
Note:
A type-III survivorship curve is found in some birds, black-tailed deer, oysters, and other shellfish, insects, and oak trees. Although we have discussed the three different types of survivorship curves, such clear demarcations do not exist in reality. Survivorship exists on a scale, with types I and III representing the extremes.
Recently Updated Pages
Basicity of sulphurous acid and sulphuric acid are
Master Class 12 Economics: Engaging Questions & Answers for Success
Master Class 12 Biology: Engaging Questions & Answers for Success
Master Class 11 English: Engaging Questions & Answers for Success
Master Class 11 Physics: Engaging Questions & Answers for Success
Master Class 11 Computer Science: Engaging Questions & Answers for Success
Trending doubts
What is the Total Duration of Football Match?
What is BLO What is the full form of BLO class 8 social science CBSE
Explain the Treaty of Vienna of 1815 class 10 social science CBSE
Draw a labelled sketch of the human eye class 12 physics CBSE
In football, which nation is called "La Roja"?
Difference Between Plant Cell and Animal Cell