


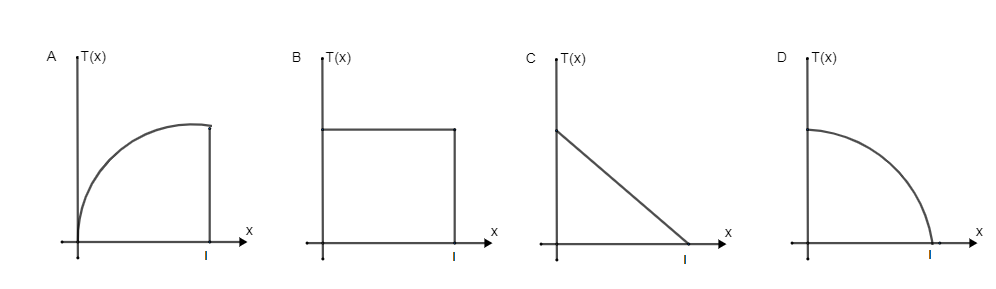
A uniform rod of length l is being rotated in a horizontal plane with a constant angular speed about an axis passing through one of its ends if the tension generated in the rod due to the rotation is T (x) at a distance x from the axis then which of the following graphs depicts it most closely?
Answer
579k+ views
Hint: First we will use a formula for the tension and by putting values in the formula of tension we will lead to a parabolic equation and that can give us the correct answer from given options.
Formula used: $Tx=m{{\omega }^{2}}r$
Complete answer:
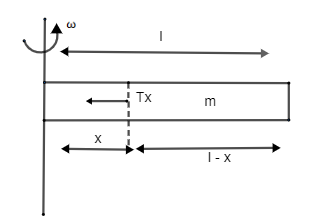
It is given that mass of rod of length l is M so if we assume mass of rod from the distance x from the axis is m then mass (m) of rod will be given by
$m=\dfrac{M}{l}\left( l-x \right).....\left( 1 \right)$
Now formula for tension (Tx) is,
$Tx=m{{\omega }^{2}}r....\left( 2 \right)$
m = mass
Tx is the tension in the rod
r is center of mass
r is center of mass now the center of mass from axis is given by
\[\begin{align}
& \Rightarrow r=x+\dfrac{l-x}{2} \\
& \Rightarrow r=2x+\dfrac{l-x}{2} \\
& \therefore r=\dfrac{x+l}{2}....(3) \\
\end{align}\]
Now substitute value at equation (1) and (3) in equation (2)
$\begin{align}
& \Rightarrow Tx=\dfrac{M}{l}(l-x){{\omega }^{2}}\dfrac{\left( l+x \right)}{2} \\
& \Rightarrow Tx=\dfrac{M}{2l}\left( {{l}^{2}}-{{x}^{2}} \right){{\omega }^{2}} \\
& \Rightarrow Tx=\dfrac{M{{\omega }^{2}}l}{2}-\dfrac{M{{\omega }^{2}}{{x}^{2}}}{2l} \\
& \therefore Tx-\dfrac{M{{\omega }^{2}}l}{2}=-\dfrac{M{{\omega }^{2}}}{2l}{{x}^{2}} \\
\end{align}$
Now if we observe the equation it will look like a parabolic equation and when we see from given options the correct match of the equation is option (D).
Hence the correct option is (D).
Note:
In the final equation there will be confusion in both the options (A) and option (D) but when we put Tx = 0 and x = 0 alternating we will lead to the correct option and thus (D) is the correct option.
For example when we put one of two values zero we get other variable value so when we put Tx = 0 the value of x will be l and similar we can get value of Tx by putting x = 0 hence we could consider that the graph belong our solution equation is option (D) not option (A) in option A graph start from (0,0) but when we put value of both variable (0,0) it is not proved by our parabolic equation hence the option (A) is incorrect.
Formula used: $Tx=m{{\omega }^{2}}r$
Complete answer:
It is given that mass of rod of length l is M so if we assume mass of rod from the distance x from the axis is m then mass (m) of rod will be given by
$m=\dfrac{M}{l}\left( l-x \right).....\left( 1 \right)$
Now formula for tension (Tx) is,
$Tx=m{{\omega }^{2}}r....\left( 2 \right)$
m = mass
Tx is the tension in the rod
r is center of mass
r is center of mass now the center of mass from axis is given by
\[\begin{align}
& \Rightarrow r=x+\dfrac{l-x}{2} \\
& \Rightarrow r=2x+\dfrac{l-x}{2} \\
& \therefore r=\dfrac{x+l}{2}....(3) \\
\end{align}\]
Now substitute value at equation (1) and (3) in equation (2)
$\begin{align}
& \Rightarrow Tx=\dfrac{M}{l}(l-x){{\omega }^{2}}\dfrac{\left( l+x \right)}{2} \\
& \Rightarrow Tx=\dfrac{M}{2l}\left( {{l}^{2}}-{{x}^{2}} \right){{\omega }^{2}} \\
& \Rightarrow Tx=\dfrac{M{{\omega }^{2}}l}{2}-\dfrac{M{{\omega }^{2}}{{x}^{2}}}{2l} \\
& \therefore Tx-\dfrac{M{{\omega }^{2}}l}{2}=-\dfrac{M{{\omega }^{2}}}{2l}{{x}^{2}} \\
\end{align}$
Now if we observe the equation it will look like a parabolic equation and when we see from given options the correct match of the equation is option (D).
Hence the correct option is (D).
Note:
In the final equation there will be confusion in both the options (A) and option (D) but when we put Tx = 0 and x = 0 alternating we will lead to the correct option and thus (D) is the correct option.
For example when we put one of two values zero we get other variable value so when we put Tx = 0 the value of x will be l and similar we can get value of Tx by putting x = 0 hence we could consider that the graph belong our solution equation is option (D) not option (A) in option A graph start from (0,0) but when we put value of both variable (0,0) it is not proved by our parabolic equation hence the option (A) is incorrect.
Recently Updated Pages
Master Class 11 Social Science: Engaging Questions & Answers for Success
Master Class 11 English: Engaging Questions & Answers for Success
Master Class 11 Maths: Engaging Questions & Answers for Success
Master Class 11 Chemistry: Engaging Questions & Answers for Success
Master Class 11 Biology: Engaging Questions & Answers for Success
Master Class 11 Physics: Engaging Questions & Answers for Success
Trending doubts
One Metric ton is equal to kg A 10000 B 1000 C 100 class 11 physics CBSE
Difference Between Prokaryotic Cells and Eukaryotic Cells
There are 720 permutations of the digits 1 2 3 4 5 class 11 maths CBSE
Draw a diagram of a plant cell and label at least eight class 11 biology CBSE
Two of the body parts which do not appear in MRI are class 11 biology CBSE
Which gas is abundant in air class 11 chemistry CBSE