


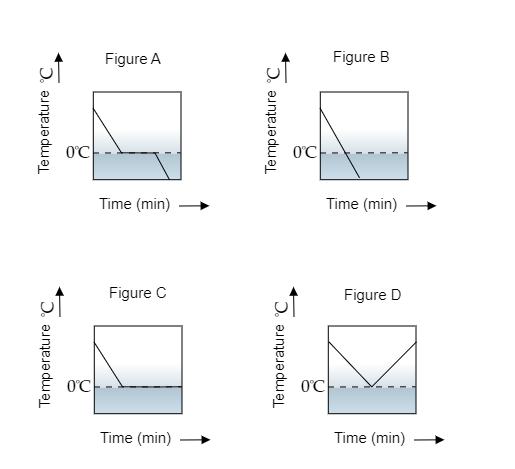
A glass tumbler containing hot water is kept in the freezer compartment of a refrigerator (temperature $ < 0^\circ C$ ). If you could measure the temperature of the content of the tumbler, which of the graphs as shown in the figure would correctly represent the change in its temperature as a function of time?
Answer
633.9k+ views
Hint:Whenever heat flows from a hot body to a colder body, the temperature of the hotter body will decrease at a constant rate. When the hot water is placed in the freezer, the heat from the hot water will flow to the colder freezer. So the temperature of the water will decrease until it reaches its freezing point. During a phase change, the temperature of the body will remain constant.
Complete step by step answer.
Step 1: Explain how the transfer of heat changes the temperature of the hot water.
Here, the heat transfers from the hot water to the cold freezer. This transfer of heat causes the temperature of the water to reduce. This reduction of temperature will continue until the water in the tumbler freezes i.e., its freezing point gets attained. The freezing point of water is $0^\circ {\text{C}}$ . The temperature then remains constant for some time so that the entire water freezes to form to ice. Once that is attained, its temperature will keep on decreasing at a constant rate.
So the variation of temperature over time will resemble the graph shown by figure a.
So the correct option is A.
Note: As water freezes to ice a change of phase takes place. The latent heat is used to ensure the temperature of the ice formed in the tumbler does not remain at $0^\circ {\text{C}}$ forever. This temperature keeps on decreasing as the refrigerator keeps working to maintain its contents at a temperature previously set by someone. The temperature of the refrigerator is much lower than $0^\circ {\text{C}}$ . If the refrigerator were to be switched off, then the ice formed would melt and its temperature would increase.
Recently Updated Pages
Basicity of sulphurous acid and sulphuric acid are
Master Class 11 English: Engaging Questions & Answers for Success
Master Class 11 Physics: Engaging Questions & Answers for Success
Master Class 11 Computer Science: Engaging Questions & Answers for Success
Master Class 11 Chemistry: Engaging Questions & Answers for Success
Master Class 11 Social Science: Engaging Questions & Answers for Success
Trending doubts
Difference Between Prokaryotic Cells and Eukaryotic Cells
Two of the body parts which do not appear in MRI are class 11 biology CBSE
One Metric ton is equal to kg A 10000 B 1000 C 100 class 11 physics CBSE
10 examples of friction in our daily life
Draw a diagram of nephron and explain its structur class 11 biology CBSE
What will happen if the mucus is not secreted by the class 11 biology CBSE