


Class 8 Maths NCERT Exemplar Solutions Chapter 12 Introduction to Graphs
In examples 1 and 2, there are four options out of which one is correct. Write the correct answer.
1. Every point on the x axis is of the form.
(a) (0, y)
(b) (x, 0)
(c) (x, y)
(d) (x, 1)
Ans: Every point on X axis is always of the form (x, 0)
Hence, the correct option is (b)
2. The given graph shows Nisha’s trip to a mall by a car. Observe the graph carefully and find what was she doing between 5 pm and 7 pm?
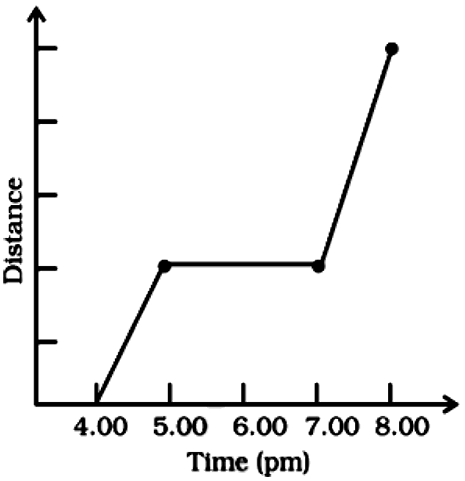
(a) Driving to the mall.
(b) Driving back home.
(c) Was not driving.
(d) Not enough data to answer.
Ans:
From the given graph, it can be clearly seen that Nisha was driving between 5 pm and 7 pm.
Hence, the correct option is (c)
In examples 3 and 4, fill in the blanks to make the statements true.
3. In a __________ graph, all the points on the graph lie on the same straight line.
Ans: All the points on the graph lie on the same straight line in a Linear Graph
Hence, In a linear graph, all the points on the graph lie on the same straight line.
4. The coordinates of the origin are ___________
Ans: (0, 0) are the coordinates of the origin.
Hence, the coordinates of the origin are (0, 0).
In examples 5 and 6, state whether the statements are true (T) or false (F).
5. Points (3, 4) and (4, 3) represent the same point on the graph.
Ans: Points (3, 4) and (4, 3) do not represent the same point on the graph
Hence, the given statement is False.
6. The y coordinate of any point lying on the x axis will be 0.
Ans: The coordinate of ordinates i.e y coordinate will be 0 on x axis.
Hence, the given statement is True.
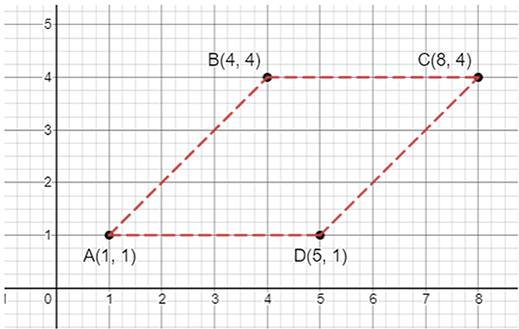
7. Plot the points (4, 4), (1, 3), (4, 2) and (7, 3) on a graph paper and connect them with line segments. Name the shape formed by these points.
Ans:
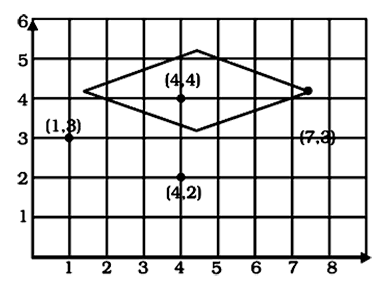
Clearly the shape forming in the graph is Rhombus.
8. Write the coordinates of all the points in the given graph.
Ans:
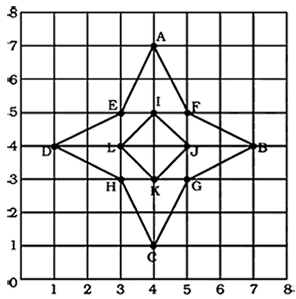
The coordinates of point (A) are: (4, 7)
The coordinates of point (B) are: (7, 4)
The coordinates of point (C) are: (4, 1)
The coordinates of point (D) are: (1, 4)
The coordinates of point (E) are: (3, 5)
The coordinates of point (F) are: (5, 5)
The coordinates of point (G) are: (5, 3)
The coordinates of point (H) are: (3, 3)
The coordinates of point (I) are: (4, 5)
The coordinates of point (J) are: (5, 4)
The coordinates of point (K) are: (4, 3)
The coordinates of point (L) are: (3, 4)
9. The following is a conversion graph of temperature in °C and °F. Use the graph to answer the following questions.
(a) Convert 140 °F to °C.
(b) Convert 20 °C to °F
Ans: From the given graph, we can clearly see
(a) 140 °F = 60°C
(b) 20 °C =68°F
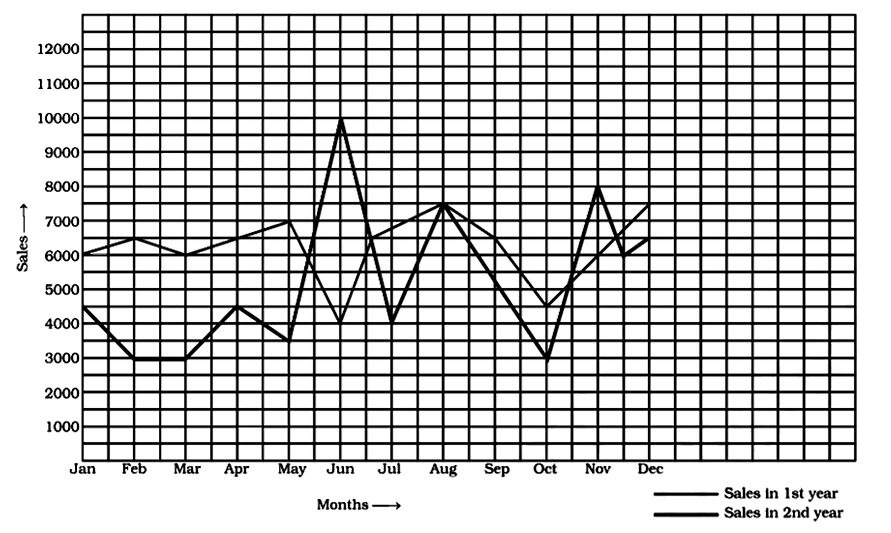
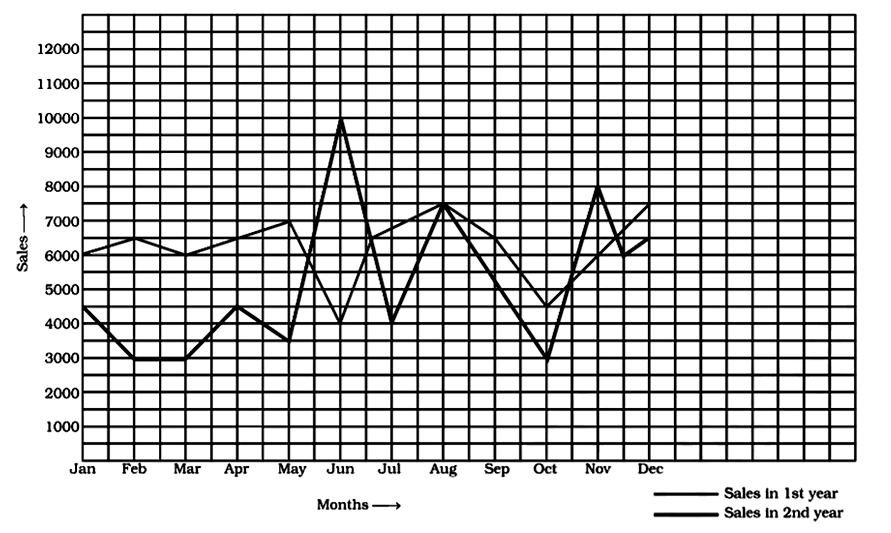
10. Following graph shows a comparison of the approximate sale of items manufactured by a company for the first two years of its operation.
In which months there was maximum difference in the sale of items of two years?
In which year was there more stability in the sale of items?
In which month the sale remains the same in both the years?
In which month was the sales of first year less than that of second year?
Ans:
From Graph, the maximum difference was in June.
From Graph, In the first year, there was more stability in sales.
In August, the sales remained the same.
In June and November the sales of the first year were less than that of the second year.
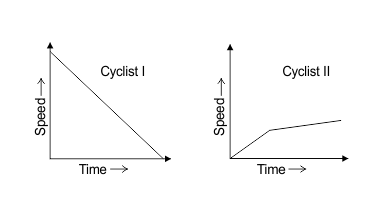
11. The given graphs show the progress of two different cyclists during a ride. For each graph, describe the rider’s progress over the period of time?
Ans:
From the graph, the speed of cyclist I decreases steadily as the time passes.
Speed of cyclist II increases for a small period of time, and then passes rapidly.
12. A double bar graph is useful for the __________ of two sets of data.
Data represented in a circular form is called a _________ chart.
The graph of a linear equation is always a __________ line.
The Cartesian system used two axes which are __________ to each other.
Ans: A double bar graph is useful for the comparison of two sets of data.
Data represented in a circular form is called a pie chart.
The graph of a linear equation is always a straight line.
The Cartesian system used two axes which are perpendicular to each other
In questions 1 to 10, there are four options out of which one is correct.
Write the correct answer.
1. Comparison of parts of a whole may be done by a
Bar graph
Pie chart
Linear graph
Line graph
Ans:
The correct answer is option (b).
Pie chart is a way to compare and represent the data. It is also termed as a ‘pictorial representation of the data’.
2. A graph that displays data that changes continuously over periods of time is
Bar graph
Pie chart
Histogram
Line graph
Ans:
The correct answer is option (d).
Line graph is a way to compare and represent the data. It displays the relation among two varying quantities.
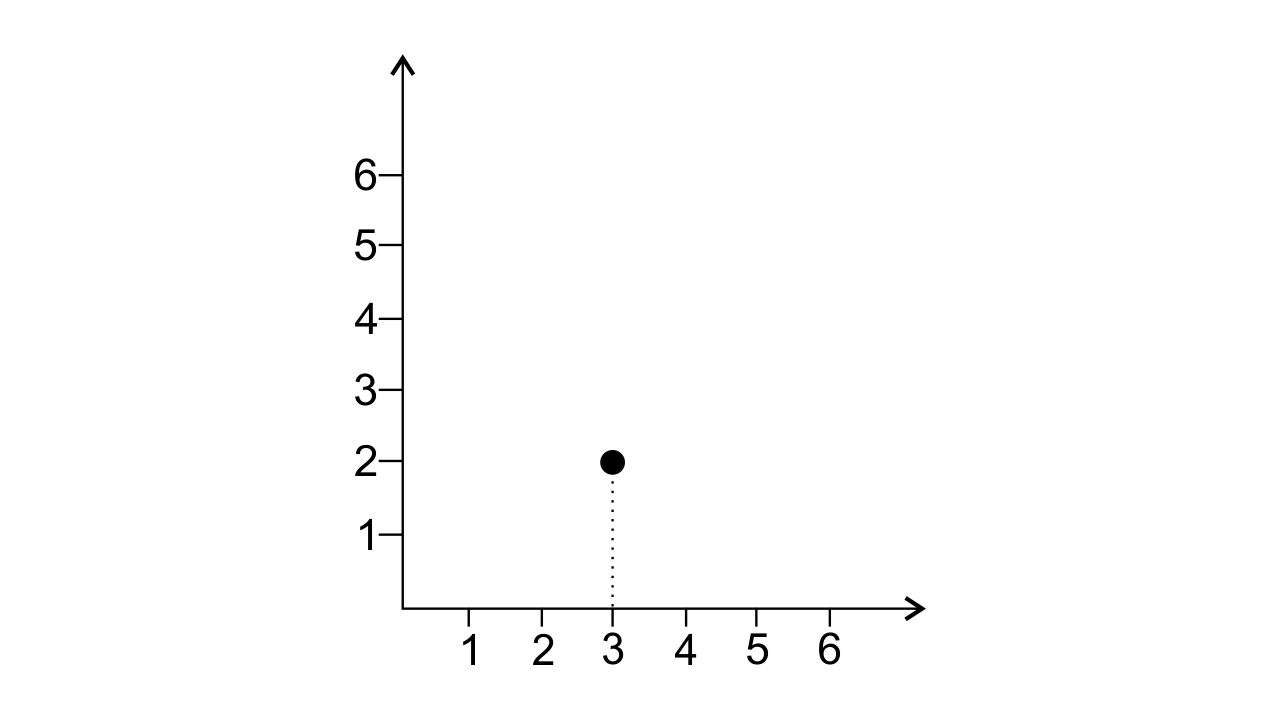
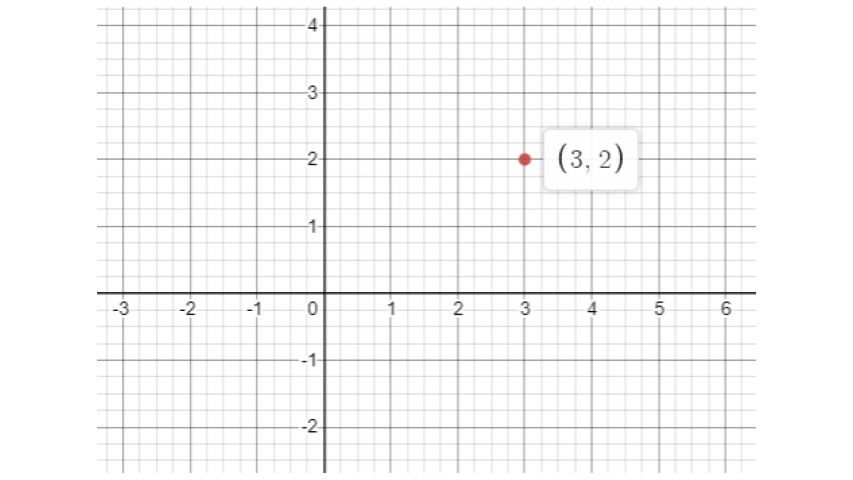
3. In the given graph the coordinates of point x are
(0, 2)
(2, 3)
(3, 2)
(3, 0)
Ans:
The correct answer is option (c).
In the given graph the coordinates of point x are (3, 2). The graph is shown below:
4. In the given graph the letter that indicates the point (0, 3) is
P
Q
R
S
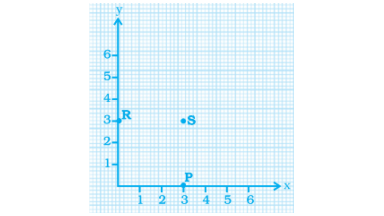
Ans:
The correct answer is option (c).
Alphabet R indicates the point (0, 3). Because at Y-Axis x coordinate will always be zero.
5. The point (3, 4) is at a distance of
3 from both the axis
4 from both the axis
4 from the x axis and
3 from x axis and 3 from y axis from y axis
Ans:
The correct answer is option (c).
The distance of the point from the y-axis is termed the x-coordinate. The distance of a point from the x-axis is termed the y-coordinate.
6. A point which lies on both the axes is __________.
(0, 0)
(0, 1)
(1, 0)
(1, 1)
Ans:
The correct answer is option (a).
A point which lies on both the axis is termed as the origin.
7. The coordinates of a point at a distance of 3 units from the x axis and 6 units from the y axis is
(0, 3)
(6, 0)
(3, 6)
(6, 3)
Ans:
The correct answer is option (d).
The distance of a point from the y-axis is termed the x-coordinate.
The distance of a point from the x-axis is termed the y-coordinate.
So, the points are (6, 3).
8. In the given figure the position of the book on the table may be given by
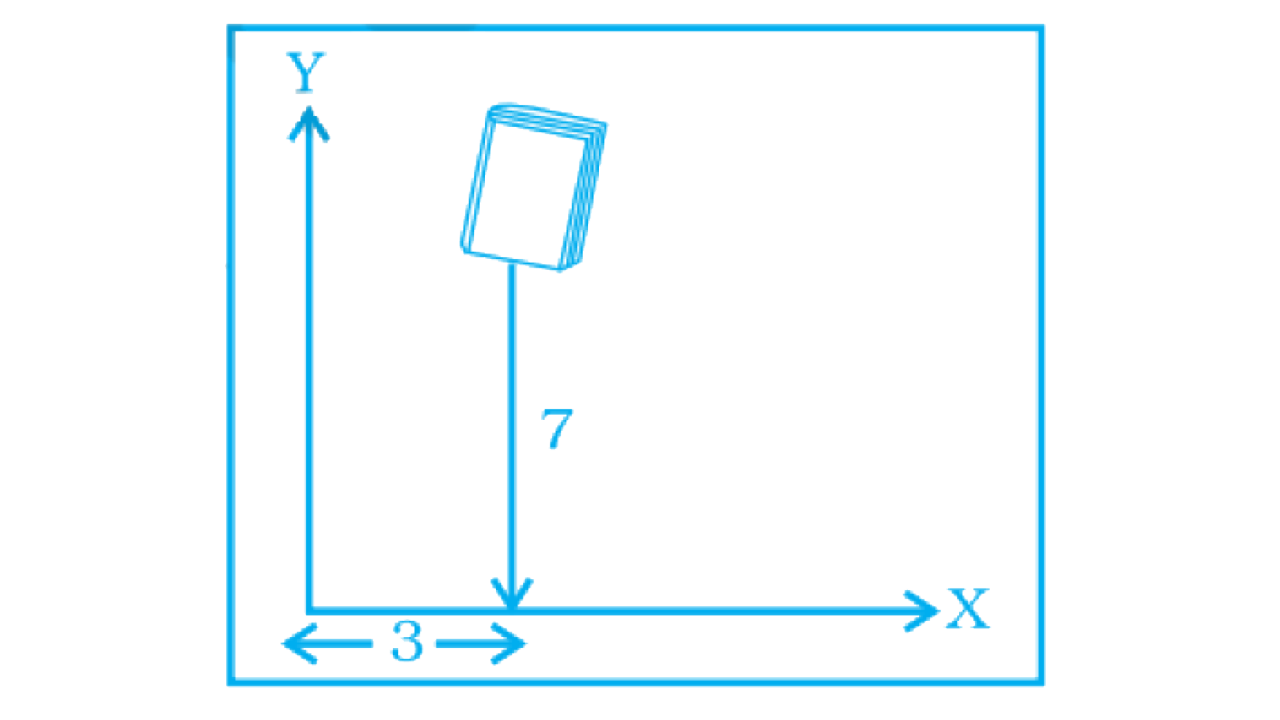
(7, 3)
(3, 7)
(3, 3)
(7, 7)
Ans:
The correct answer is option (b).
The book is at a distance of 7 units from ‘x-axis’ and 3 units from ‘y axis’.
9. Data was collected on a student’s typing rate and a graph was drawn as shown below. Approximately how many words had this student typed in 30 seconds?
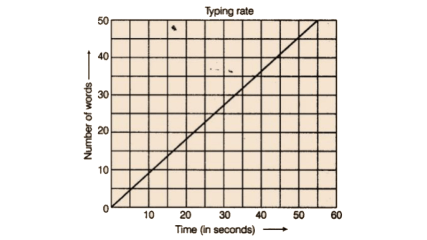
20
24
28
34
Ans:
The correct answer is option (c).
Approximately 28 words were typed in 30 seconds.
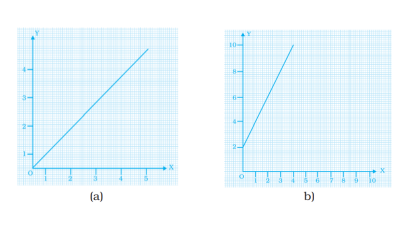
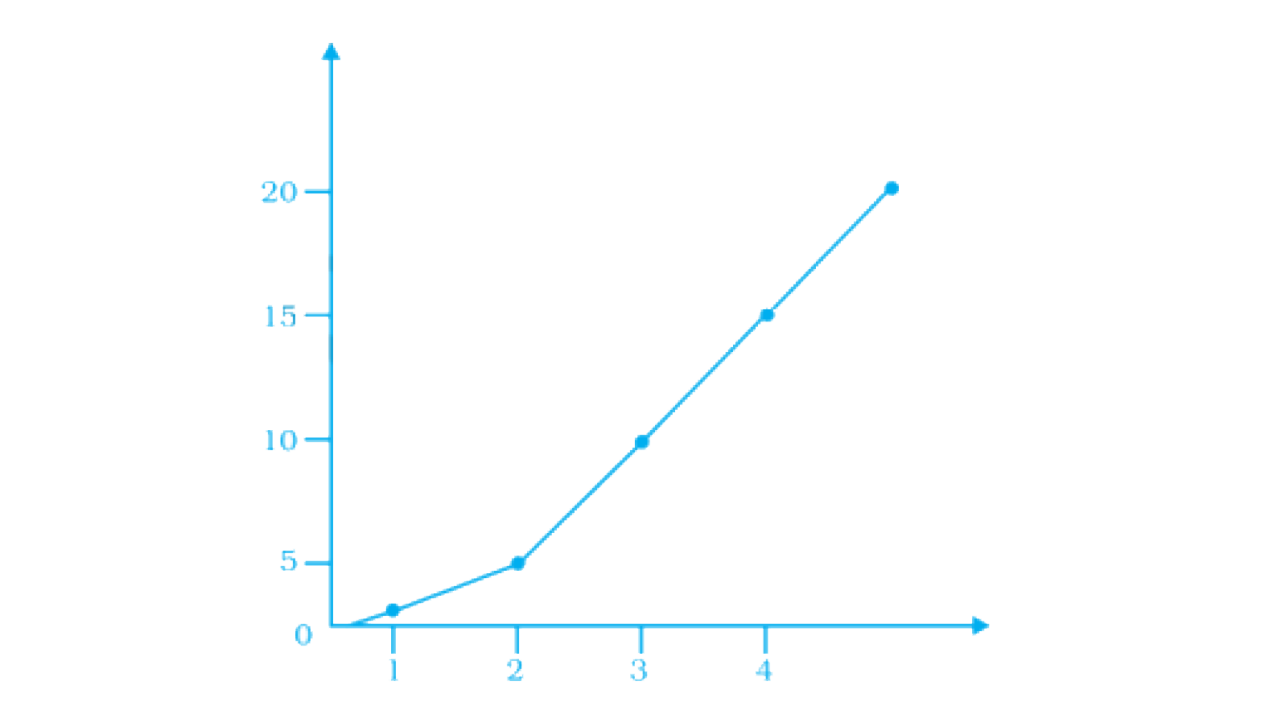
10. Which graphs of the following represent the table below?
(a)
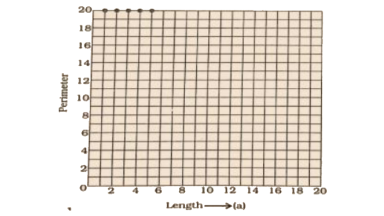
(b)
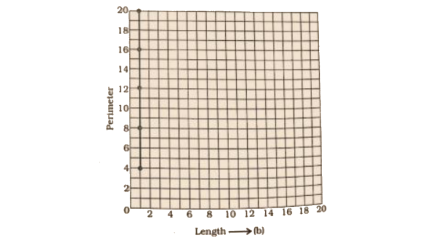
(c)
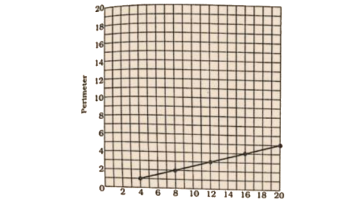
(d)
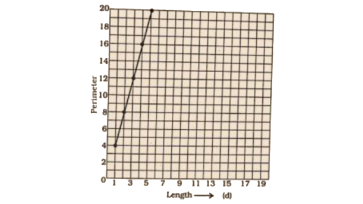
Ans:
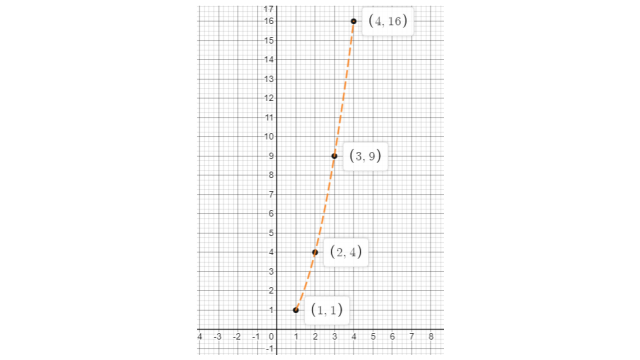
The correct answer is option (d).
As per question, the points = (1, 4), (2, 8), (3, 12), (4, 16) and (5, 20)
All these given points are mentioned in option (d).
In questions 11 to 25, fill in the blanks to make the statements true.
11. __________ displays data that changes continuously over periods of time.
Ans:
Fill up: Line graph.
12. The relation between dependent and independent variables are shown through a __________.
Ans:
Fill up: Graph.
13. We need __________ coordinates to represent a point on the graph sheet.
Ans:
Fill up: Two.
14. A point in which the x-coordinate is zero and y coordinate is nonzero will lie on the ________.
Ans:
Fill up: y-axis.
15. The horizontal and vertical lines in a line graph are usually called __________ and __________.
Ans:
Fill up: x-axis and y-axis.
16. The process of fixing a point with the help of thecoordinates are known as the __________ of the point.
Ans:
Fill up: plotting.
17. The distance of any point from the y-axis is the __________ coordinate.
Ans:
Fill up: x.
18. All points with a y-coordinate as zero lie on the__________.
Ans:
Fill up: x-axis.
19. For the point (5, 2), the distance from the x -axis is__________ units.
Ans:
Fill up: 2.
20. The x-coordinate of any point lying on the y-axis will be __________.
Ans:
Fill up: Zero.
21. The y-coordinate of the point (2, 4) is __________.
Ans:
Fill up: 4.
22. In point (4, 7), 4 denotes the __________.
Ans:
Fill up: x-coordinate.
23. A point has 5 as its x–coordinate and 4 as its y–coordinate. Then the coordinates of the point are given by __________.
Ans:
Fill up: (5, 4).
24. In the coordinates of a point, the second number denotes the_______ _.
Ans:
Fill up: y-coordinate.
25. The point where the two axes intersect is called the__________.
Ans:
Fill up: Origin or (0, 0) point.
In the questions 26 to 34, state whether the statements are true (T) or false (F).
26. For fixing a point on the graph sheet we need two coordinates.
Ans:
The given statement is true.
27. A line graph can also be a whole unbroken line.
Ans:
The given statement is true.
28. The distance of any point from the x -axis is called the x-coordinate.
Ans:
The given statement is false.
The distance of any point from the x -axis is termed as y-coordinate.
29. The distance of the point (3, 5) from the y-axis is 5.
Ans:
The given statement is false.
As per statement, the x-coordinate is 3. Therefore, the distance ofthe given point from the y-axis is 3.
30. The ordinate of a point is its distance from the y axis.
Ans:
The given statement is false.
Ordinate is termed the y-coordinate of points. This is also known as distance from the x-axis.
31. In the point (2, 3), 3 denotes the y-coordinate.
Ans:
The given statement is true.
32. The coordinates of the origin are (0, 0).
Ans:
The given statement is true.
33. The points (3, 5) and (5, 3) represent the same point.
Ans:
The given statement is false.
No, both of the given points are not the same points.
In the points (3, 5)
3 = x-coordinate
5 = y-coordinate
In the points (5, 3)
5 = x-coordinate
3 = y-coordinate
34. The y-coordinate of any point lying on the x -axis will be zero.
Ans:
The given statement is true.
35. Match the coordinates given in Column A with the items mentioned in column B.
Ans:
The complete table is
36. Match the coordinates given in Column A with the items mentioned in column B.
Ans:
The complete table is
37. From the given graph, choose the letters that indicate the location of the points given below.
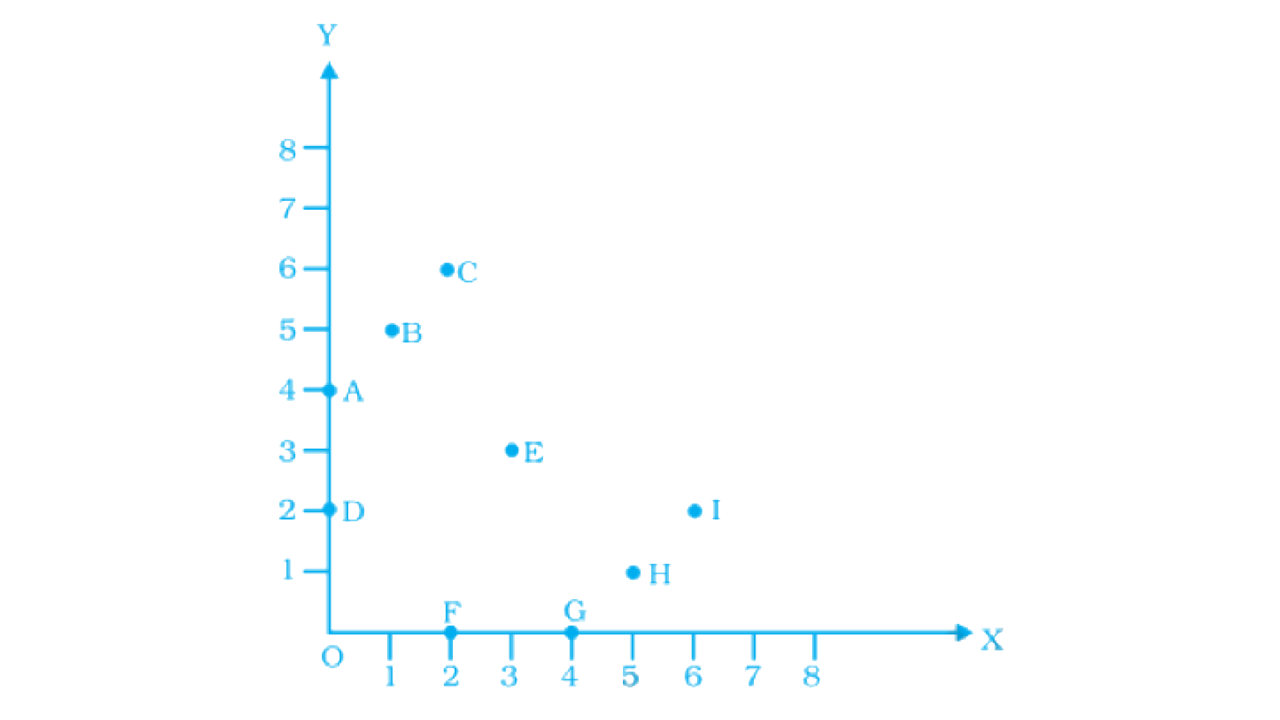
a) (2, 0)
b) (0, 4)
c) (5, 1)
d) (2, 6)
e) (3,3)
Ans:
According to the given graph,
F is the point that represents the position of the point (2, 0).
In the given graph, the x-coordinate is 2 and y coordinate is 0.
A is the point that represents the position of the point (0, 4).
In the given graph, the x-coordinate is 0 and y coordinate is 4.
H is the point that represents the position of the point (5, 1).
In the given graph, the x-coordinate is 5 and y coordinate is 1.
Iis the point that represents the position of the point (2,6).
In the given graph, the x-coordinate is 2 and y coordinate is 6.
E is the point that represents the position of the point (3, 3).
In the given graph, the x-coordinate is 3 and y coordinate is 3.
38. Find the coordinates of all the letters in the graph given below.
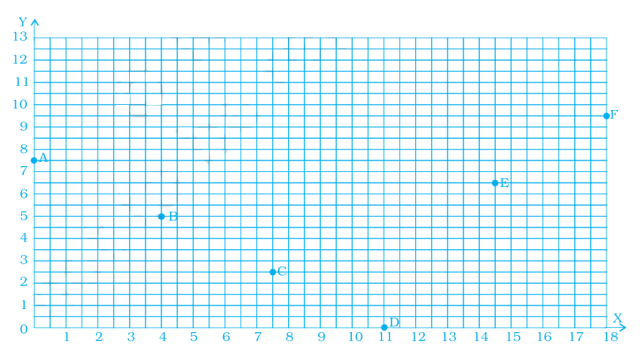
Ans:
As per question
The coordinates of point A = (0, 7.5)
The coordinates of point B = (4, 5)
The coordinates of point C = (7.5, 2.5)
The coordinates of point D = (11, 0)
The coordinates of point E = (14.5, 6.5)
The coordinates of point F = (18, 9.5)
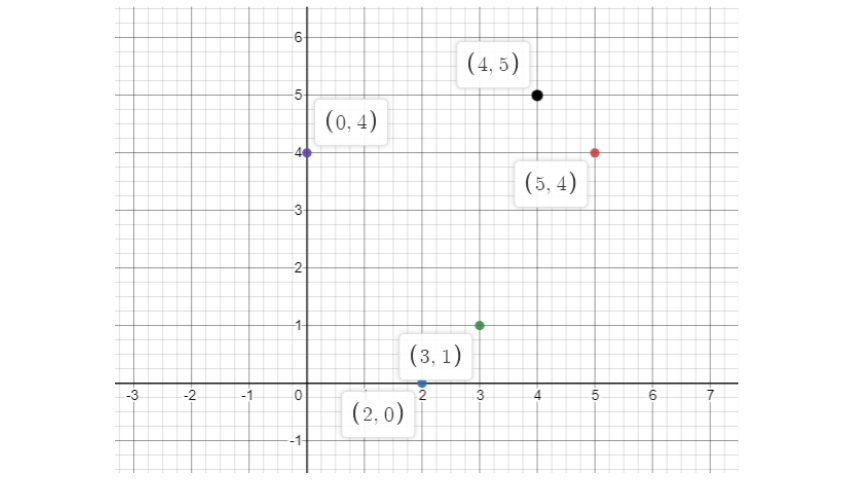
39. Plot the given points on a graph sheet.
a) (5, 4)
b) (2, 0)
c) (3, 1)
d) (0, 4)
e) (4,5)
Ans:
According to the data given in question, the graph is:
40. Study the given map of a zoo and answer the following questions.
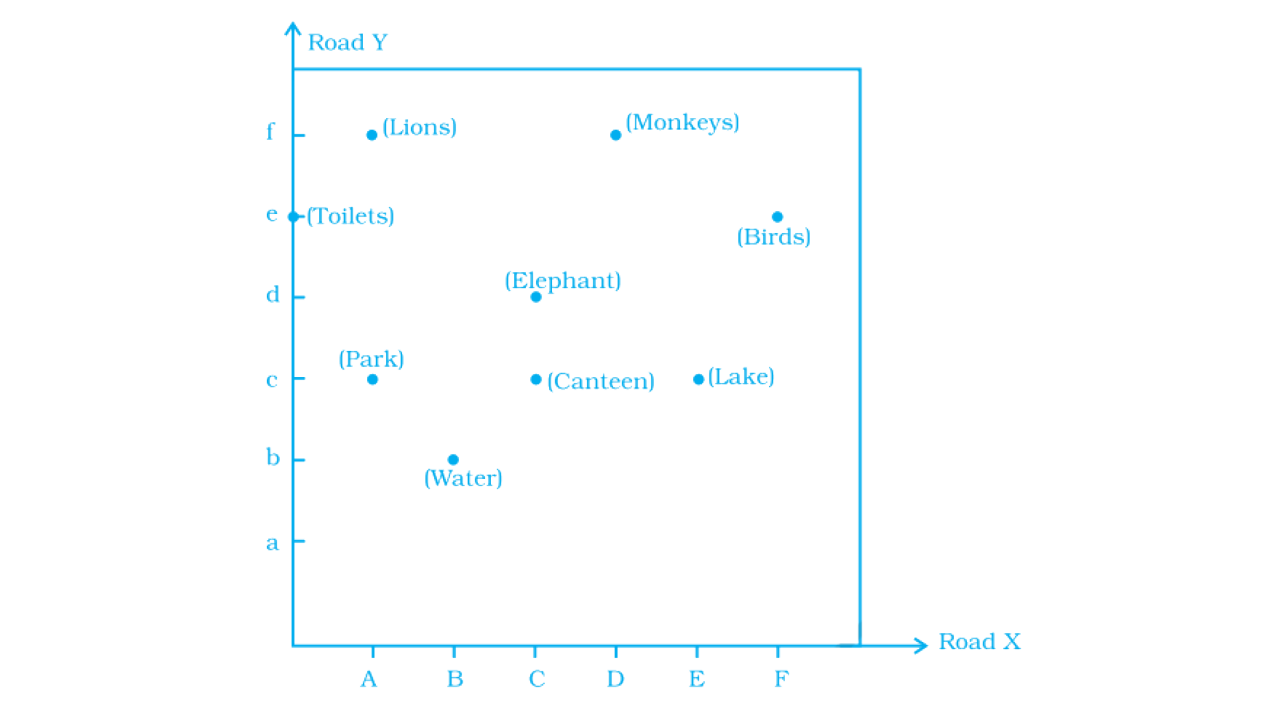
(a) Give the location of lions in the zoo.
(b) (D, f) and (C, d) represent locations of which animals in the zoo?
(c) Where are the toilets located?
(d) Give the location of the canteen.
Ans:
According to the question,
a) The location of lions in the zoo = (A,f)
b) In the zoo, (D, f) and (C, d) represent the locations of animals = Monkey and Elephant
c) Location of toilets: (0,e)
d) Location of Canteen = (C, c)
41. Write the x -coordinate (abscissa) of each of the given points.
a) (7, 3)
b) (5, 7)
c) (0, 5)
Ans:
According to the question,
a) The x-coordinate of the given points (7, 3) = 7
b) The x-coordinate of the given points (5, 7) = 5
c) The x-coordinate of the given points (0, 5) = 0
42. Write the y-coordinate (ordinate) of each of the given points.
a) (3, 5)
b) (4, 0)
c) (2, 7)
Ans:
According to the question,
a) The y-coordinate of the given points (3, 5) = 5
b) The y-coordinate of the given points (4, 0) = 0
c) The y-coordinate of the given points (2, 7) = 7
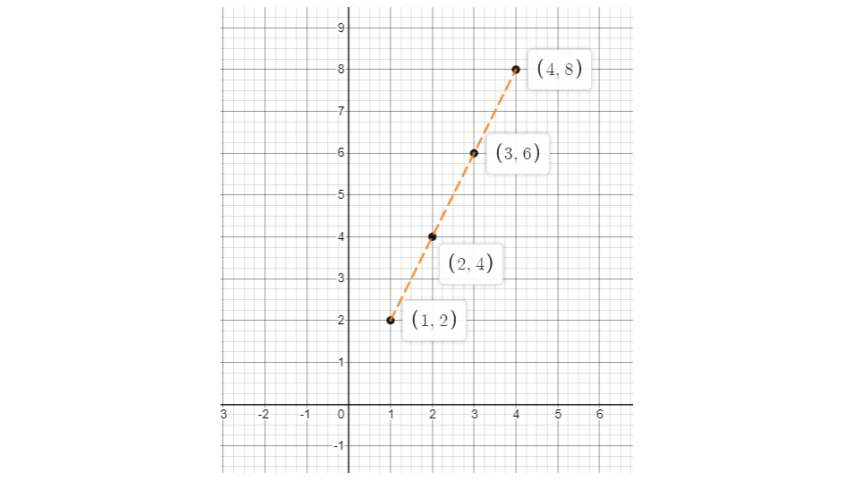
43. Plot the given points on a graph sheet and check if the points lie on a straight line. If not, name the shape theyform when joined in the given order.
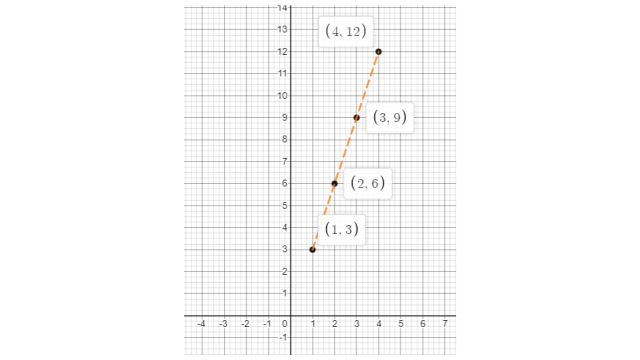
a) (1, 2), (2, 4), (3, 6), (4, 8).
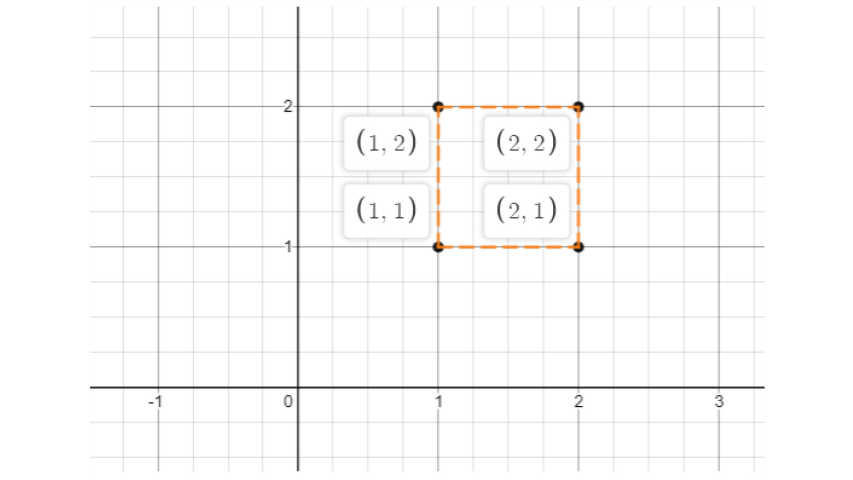
b) (1, 1), (1, 2), (2, 1), (2, 2).
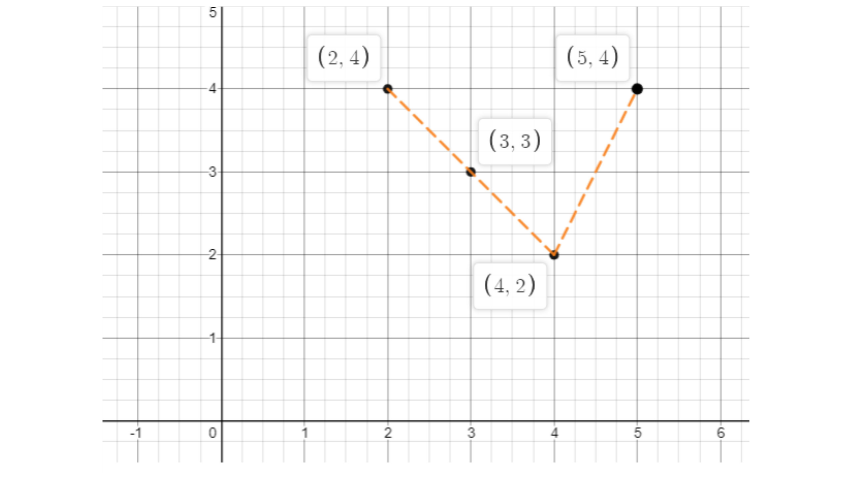
c) (4, 2), (2, 4), (3, 3), (5, 4).
Ans:
According to the question,
a) After plotting the given points, we observe that they lie in a straight line. The graph is shown below:
b) After plotting the given points, we observe that they lie in a straight line. The graph is shown below:
c) After plotting the given points, we observe that they lie in a straight line. The graph is shown below:
44. If y–coordinate is 3 times x -coordinate, form a table for it and draw a graph.
Ans:
As per question,
45. Make a line graph for the area of a square as per the given table.
Ans:
As per question,
46. The cost of a notebook is Rs 10. Draw a graph after making a table showing the cost of 2, 3, 4,....note books. Use it to find
a) The cost of 7 notebooks.
b) The number of notebooks that can be purchased with Rs 50.
Ans:
As per question,
Suppose: x = number of notebooks and y = cost of notebooks.
Now, the complete table is:
According to the above data, the graph is shown below:
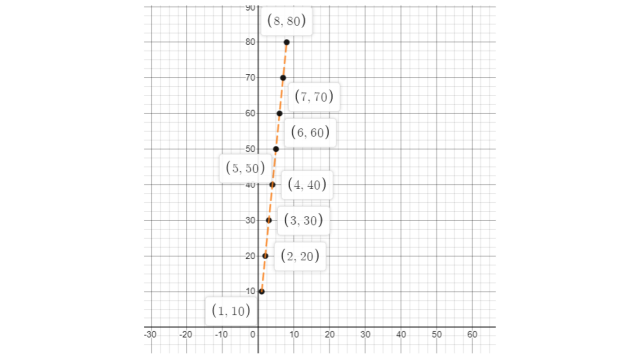
47. After observing the graph,
a) The cost of 7 notebooks = Rs. 70
b) The number of notebooks that can be purchased with Rs. 50 = 5 notebooks.
Explain the situations represented by the following distance-time graphs.
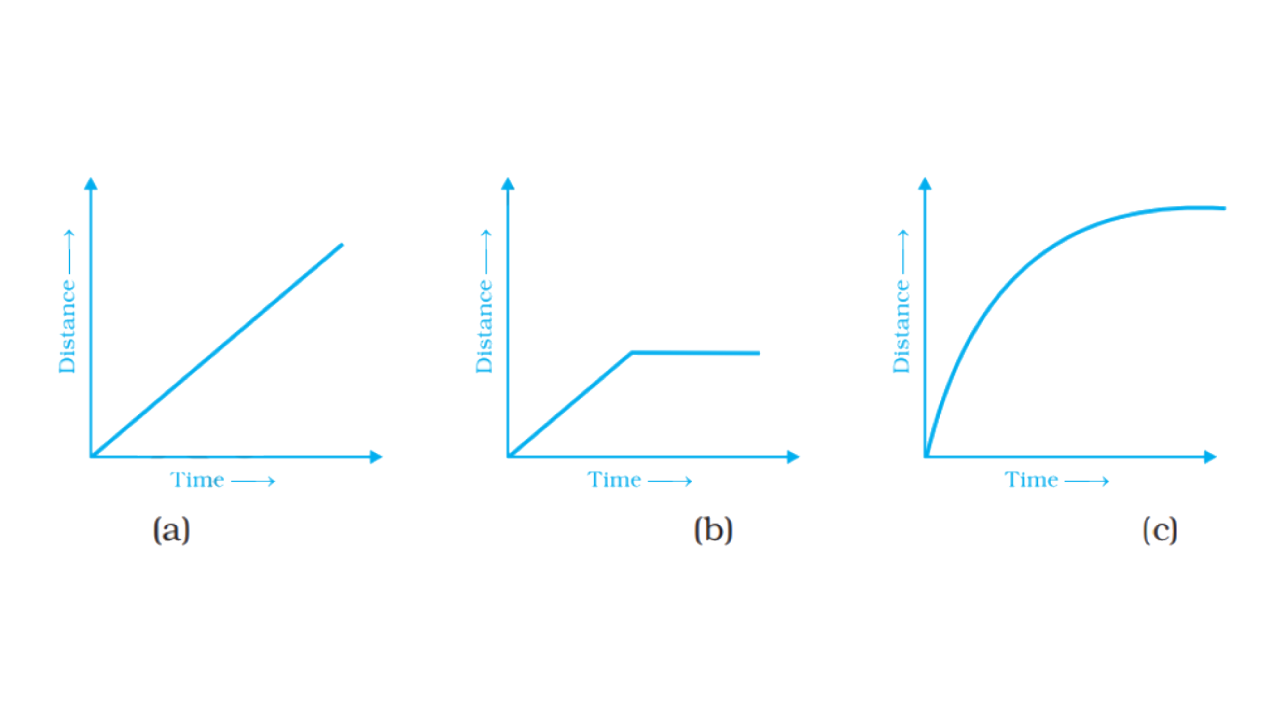
Ans:
In the graph,when the distance and time both increase together at same time period.
In the graph, the body moves equally for some time but after some time it becomes constant.
In the graph, in unequal time-period, distance and time increase rapidly.
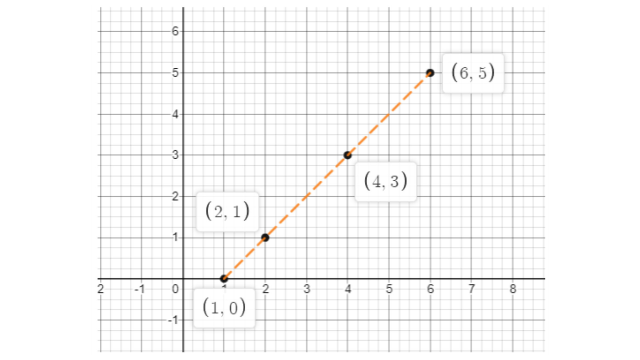
48. Complete the given tables and draw a graph for each.
a) First table:
b) Second table:
Ans:
a) First table:
The graph of the given data is shown below:
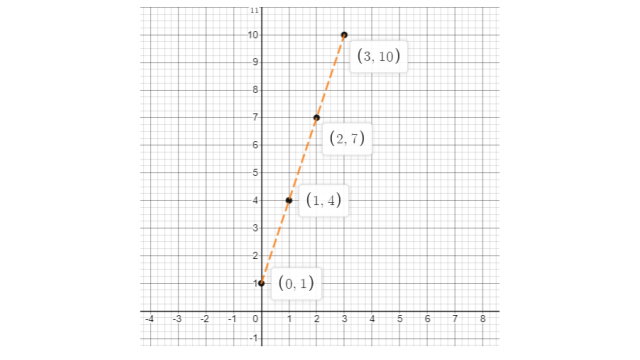
b) Second table:
The graph of the given data is shown below:
49. Study the given graphs (a) and (b) and complete the corresponding tables below.
Ans:
After observing the graphene figure (a)
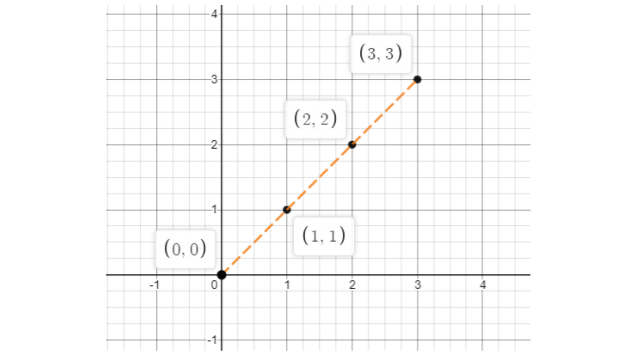
The complete table is
After observing the graphene figure (b)
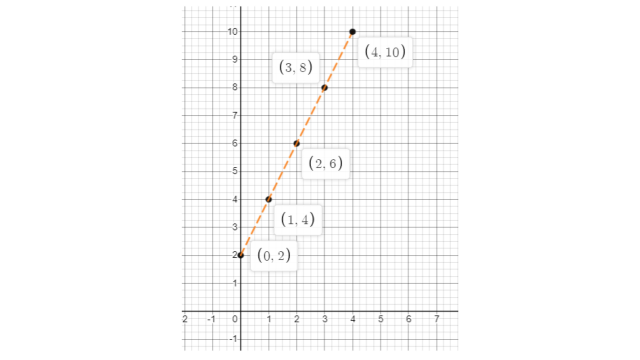
The complete table is
50. Draw a graph for the radius and circumference of a circle using a suitable scale. (Hint: Take radius = 7, 14, 21 units and so on) From the graph,
a) Find the circumference of the circle when radius is 42 units.
b) What radius will the circumference of the circle be 220 units?
Ans:
We know that, the value of $\text{ }\!\!\pi\!\!\text{ =}\frac{\text{22}}{\text{7}}$and circumference of a circle = $\text{2 }\!\!\pi\!\!\text{ r}$
Let, the radius = 7 units
So, the circumference = $\text{2 }\!\!\times\!\!\text{ }\frac{\text{22}}{\text{7}}\text{ }\!\!\times\!\!\text{ 7}$ = 44 units.
Let, the radius = 14 units
So, the circumference = $\text{2 }\!\!\times\!\!\text{ }\frac{\text{22}}{\text{7}}\text{ }\!\!\times\!\!\text{ 14}$ = 88 units.
Let, the radius = 21 units
So, the circumference = \[\text{2 }\!\!\times\!\!\text{ }\frac{\text{22}}{\text{7}}\text{ }\!\!\times\!\!\text{ 21}\] = 132 units.
Let, the radius = 28 units
So, the circumference = \[\text{2 }\!\!\times\!\!\text{ }\frac{\text{22}}{\text{7}}\text{ }\!\!\times\!\!\text{ 28}\]= 176 units.
Let, the radius = 35 units
So, the circumference = \[\text{2 }\!\!\times\!\!\text{ }\frac{\text{22}}{\text{7}}\text{ }\!\!\times\!\!\text{ 35}\] = 220 units.
Let, the radius = 42 units
So, the circumference = \[\text{2 }\!\!\times\!\!\text{ }\frac{\text{22}}{\text{7}}\text{ }\!\!\times\!\!\text{ 42}\] = 264 units.
According to the above data the complete table and graph is shown below:
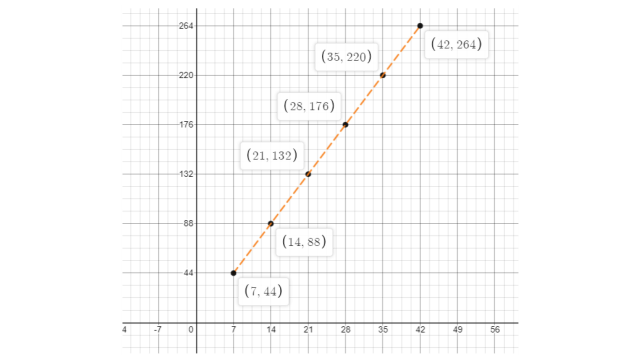
The circumference of the circle when the radius is 42 units = 264 units.
The radius of the circle when the circumference is 220 units = 35 units.
The graph shows the maximum temperatures recorded for two consecutive weeks in a town. Study the graph and answer the questions that follow.
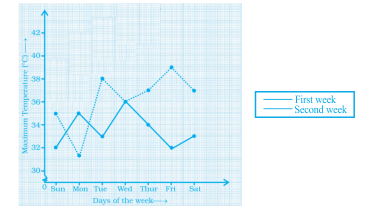
(a) What information is given by the two axes?
(b) In which week was the temperature higher on most of the days?
(c) On which day was the temperature the same in both the weeks?
(d) On which day was the difference in temperatures the maximum for both the weeks?
(e) What were the temperatures for both the weeks on Thursday?
(f) On which day was the temperature 35°C for the first week?
(g) On which day was the temperature highest for the second week?
Ans:
As per question,
a) In the given graph x-axis shows ‘days of a particular week’ and y-axis shows ‘the max. Temperature recorded’.
b) First week
c) Wednesday
d) Friday
e) The temperature on Thursday in the first week is 37o and in the second week is 34o.
f) Sunday
g) Wednesday
51. The graph given below gives the actual and expected sales of cars of a company for 6 months. Study the graph and answer the questions that follow.
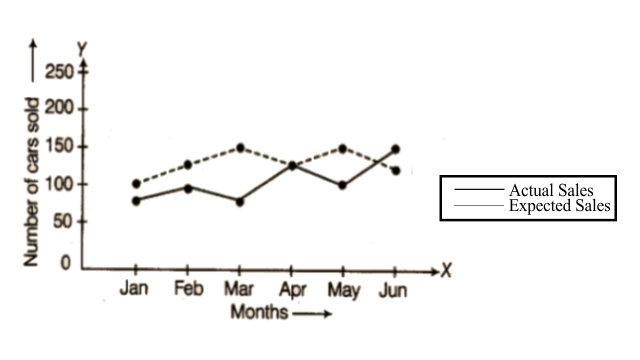
(a) In which month was the actual sales same as the expected sales?
(b) For which month(s) was (were) the difference in actual and expected sales the maximum?
(c) For which month(s) was (were) the difference in actual and expected sales the least?
(d) What was the total sales of cars in the months–Jan, Feb. and March?
(e) What is the average sales of cars in the last three months?
(f) Find the ratio of sales in the first three months to the last three months.
Ans:
As per question,
a) April
b) March
c) April
d) The total sale = 75 + 100 + 75 = 250
e) The average sale = $\frac{\text{125+100+150}}{\text{3}}\text{=125}$
f) The ratio of sale = 250: 375 = 2: 3
52. The graph given below shows the marks obtained out of 10 by Sonia in two different tests. Study the graph and answer the questions that follow.
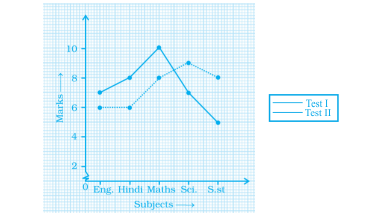
(a) What information is represented by the axes?
(b) In which subject did she score the highest in Test I?
(c) In which subject did she score the least in Test II?
(d) In which subject did she score the same marks in both the Tests?
(e) What are the marks scored by her in English in Test II?
(f) In which test was the performance better?
(g) In which subject and which test did she score full marks?
Ans:
As per question:
a) The x-axis shows subjects and the y-axis shows marks of Sonia.
b) Maths
c) English and Hindi
d) Hindi and Maths
e) 6 marks
f) In both tests, her performance is the same.
g) Test I in maths.
53. Find the coordinates of the vertices of the given figures.
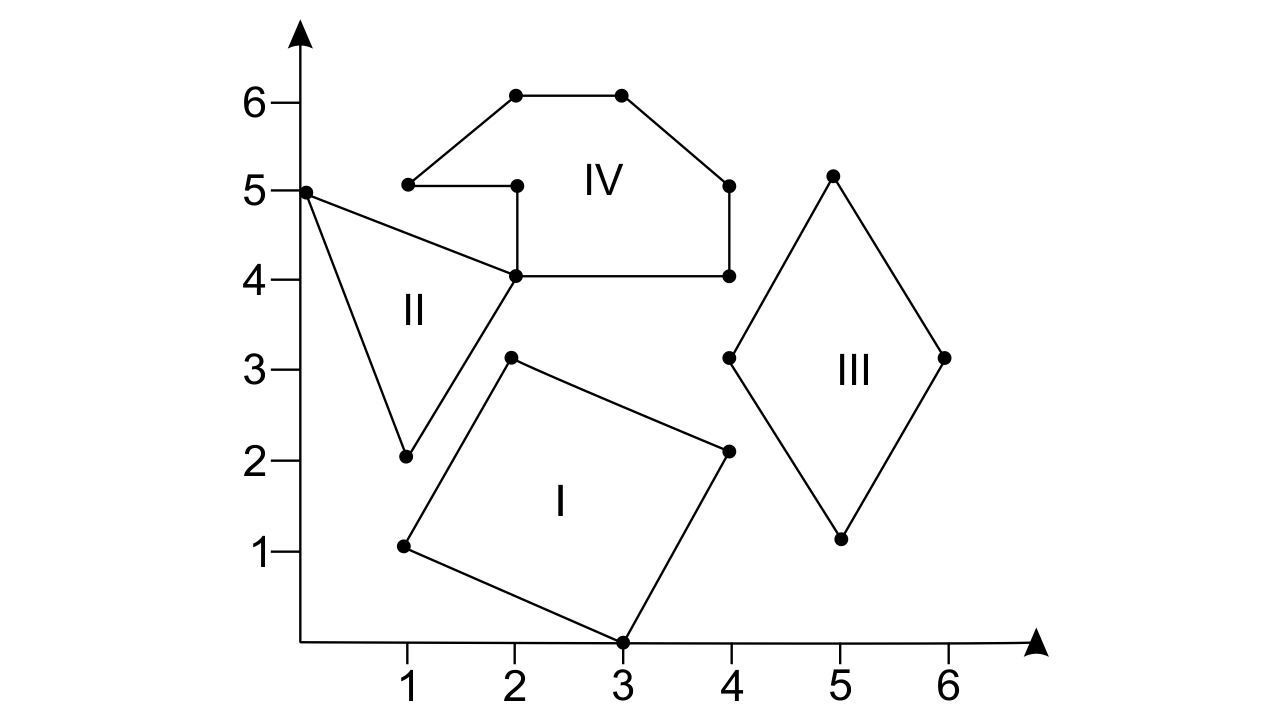
Ans:
In figure I,
The coordinates of its vertices: (1, 1), (2, 3), (4, 2) and (3, 0).
In figure II,
The coordinates of its vertices: (0, 5), (2, 4), and (1, 2).
In figure III,
The coordinates of its vertices: (1, 5), (2, 6), (3, 6), (4, 5), (2, 4) and (2, 5).
In figure IV,
The coordinates of its vertices: (4, 3), (5, 5), (6, 3) and (5, 1).
54. Study the graph given below of a person who started from his home and returned at the end of the day. Answer the questions that follow.
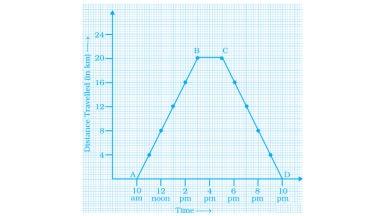
(a) At what time did the person start from his home?
(b) How much distance did he travel in the first four hours of his journey?
(c) What was he doing from 3 pm to 5 pm?
(d) What was the total distance travelled by him throughout the day?
(e) Calculate the distance covered by him in the first 8 hours of his journey.
(f) At what time did he cover 16 km of his journey?
(g) Calculate the average speed of the man from
A to B
B to C
At what time did he return home?
Ans:
As per question,
a) At 10 A.M.
b) 16 km.
c) He was taking rest.
d) Total travelled distance = 20 + 20 = 40 km.
e) 24 km.
f) At 2 P.M.
g) Average speed from
A to B = 4 km/h
average speed from B to C = 0km/hr.
At 10 P.M.
55. Plot a line graph for the variables p and q where p is two times q i.e, the equation is p = 2q. Then find.
a) The value of p when q = 3
b)The value of q when p = 8
Ans:
Given, p = 2q
In case, p = 2, then $\text{q=}\frac{\text{p}}{\text{2}}\text{=}\frac{\text{2}}{\text{2}}\text{=1}$
In case, p = 4, then $\text{q=}\frac{\text{p}}{\text{2}}\text{=}\frac{\text{4}}{\text{2}}\text{=2}$
In case, p = 6, then $\text{q=}\frac{\text{p}}{\text{2}}\text{=}\frac{\text{6}}{\text{2}}\text{=3}$
In case, p = 8, then $\text{q=}\frac{\text{p}}{\text{2}}\text{=}\frac{\text{8}}{\text{2}}\text{=4}$
Therefore, the complete table is
According to the above data the graph is shown below:
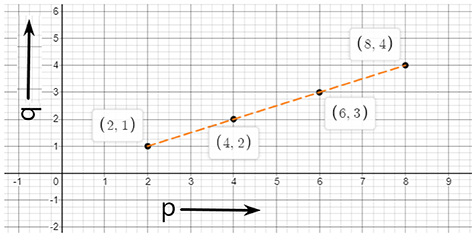
a) When q = 3, then the value of q = 6
b) When p = 8, then the value of q = 4
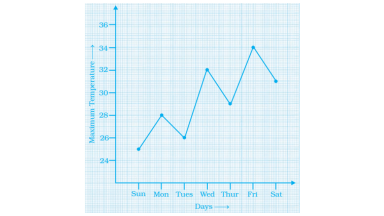
56. Study the graph and answer the questions that follow.
a) What information does the graph give?
b) On which day was the temperature the least?
c) On which day was the temperature 31°C?
d) Which was the hottest day?
Ans:
According to the question,
a) The given graph gives information about temperature in a particularweek.
The maximum temperature=34 oC and the minimum temperature= 25 oC
b) Day: Sunday and Temperature: 25 oC
c) Day: Saturday
d) Day: Friday and Temperature: 35 oC
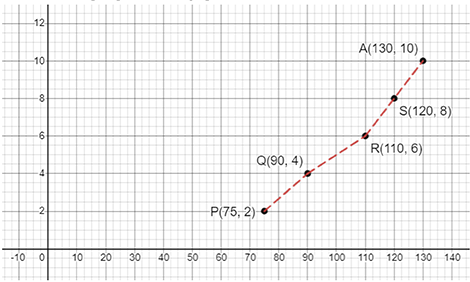
57. Study the distance-time graph given below for a car to travel to certain places and answer the questions that follow.
a) How far does the car travel in 2 hours?
b) How much time does the car take to reach R?
c) How long does the car take to cover 80 km?
d) How far is Q from the starting point?
e) When does the car reach the place S after starting?
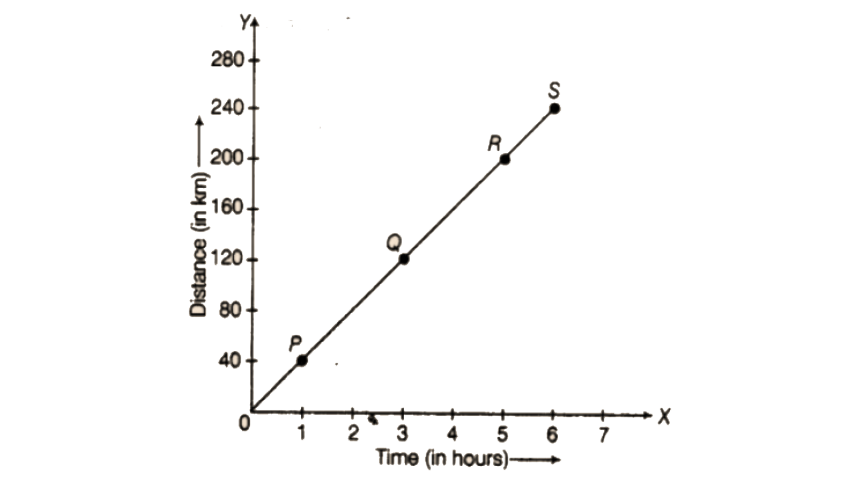
Ans:
According to the given graph:
a) 80 km
b) 5 hrs
c) 2 hours
d) 120 km.
e) 6 hours.
58. Locate the points A (1,2), B (4,2) and C (1,4) on a graph sheet taking suitable axes. Write the coordinates of the fourth point D to complete the rectangle ABCD.
Ans:
Given, the points = A (1, 2), B (4,2) and C (1,4)
The graph of these points is shown below:
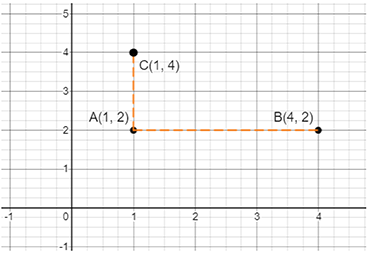
These given points represent an incomplete rectangle.
Graph after completing this rectangle:
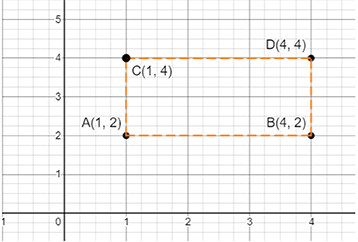
Therefore, the coordinates of point D = (4, 4)
59. Locate the points A(1,2), B (3,4) and C (5,2) on a graph sheet taking suitable axes. Write the coordinates of the fourth point D to complete the rhombus ABCD. Measure the diagonals of this rhombus and find whether they are equal or not.
Ans:
Given,
The points = A(1, 2), B(3, 4) and C(5,2) These points show an incomplete rhombus on the graph.
After completing the structure, the graph is shown below:
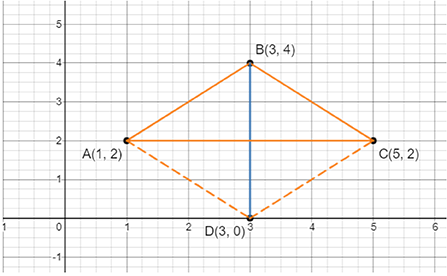
Coordinates of point D is (3, 0).
The length of diagonals in ABCD rhombus = 4 units.
Yes, the length of both the diagonals are equal.
60. Locate the points P (3,4), Q (1,0), R (0,4), S (4,1) on a graph sheet and write the coordinates of the point of intersection of line segments PQ and RS.
Ans:
As per question, the graph is shown below:
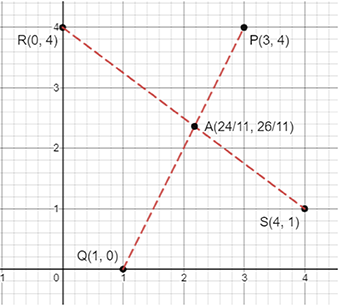
After observing the graph, we notice that the point of intersection of segment PQ and RS is A$\left( \frac{\text{24}}{\text{11}}\text{, }\!\!~\!\!\text{ }\frac{\text{26}}{\text{11}} \right)$.
61. The graph given below compares the sales of ice creams of two vendors for a week.
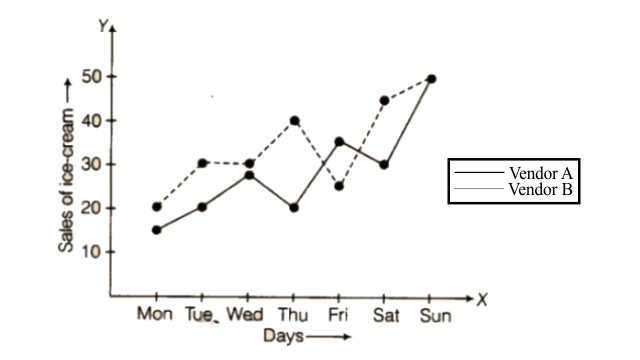
Observe the graph and answer the following questions.
a) Which vendor has sold more ice creams on Friday?
b) For which day were the sales same for both the vendors?
c) On which day did the sale of vendor A increase the most as compared to the previous day?
d) On which day was the difference in sales the maximum?
e) On which two days was the sale the same for vendor B?
Ans:
As per question,
a) Friday
b) Sunday
c) Sunday
d) Thursday
e) Tuesday and Wednesday
62. The table given below shows the temperatures recorded on a day at different times.
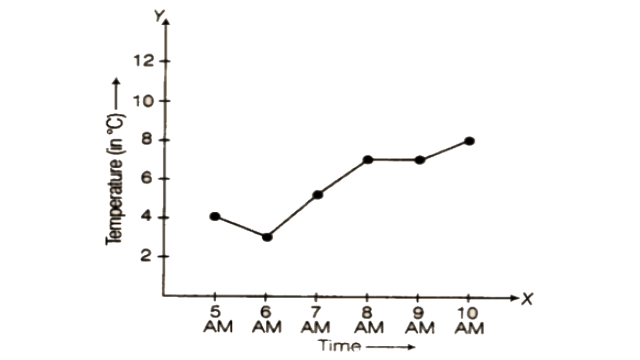
Observe the table and answer the following questions.
a) What is the temperature at 8 am?
b) At what time is the temperature 3°C?
c) During which hour did the temperature fall?
d) What is the change in temperature between 7 am and 10 am?
e) During which hour was there a constant temperature?
Ans:
As per question,
a) 7oC
b) 6 AM
c) Between 5 AM and 6 AM.
d) 3oC
e) Between 8 AM to 9 AM.
63. The following table gives the growth chart of a child.
Draw a line graph for the table and answer the questions that follow.
a) What is the height at the age of 5 years?
b) How much taller was the child at the age of 10 than at the age of 6?
c) Between which two consecutive periods did the child grow faster?
Ans:
As per question, the graph is shown below:
a) 100 cm
b) 130 cm
c) 2 – 4 years and 4 – 6 years.
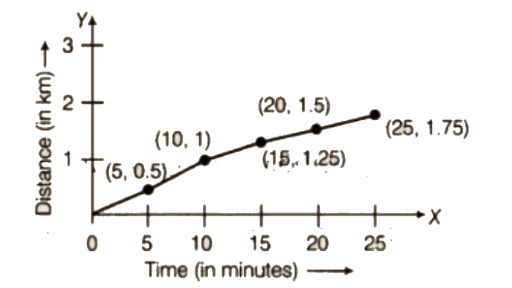
64. The following is the time-distance graph of Sneha’s walking
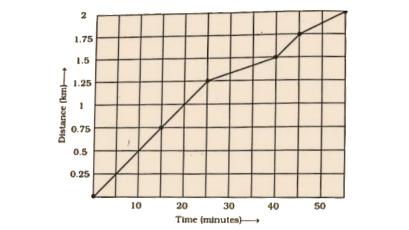
a) When does Sneha make the least progress? Explain your reasoning.
b) Find her average speed in km/hour.
Ans:
As per question,
a) Least progress = 25 to 40 min.
According to the graph, sneha travels
0.5 km in 10 minutes,
0.25 km in 5 minutes, till 25 minutes.
But the graph shows that after 25 minutes, sneha’s speed decreased between 25 minutes to 40 minutes.
This time she travelled 0.25 km in 15 minutes.
b) We know that,
Average speed = $\frac{\text{Total }\!\!~\!\!\text{ distance}}{\text{Time}}$
$\text{=}\frac{\text{2}}{\text{55}}\text{ }\!\!\times\!\!\text{ 60}$
= 2.18 km h-1
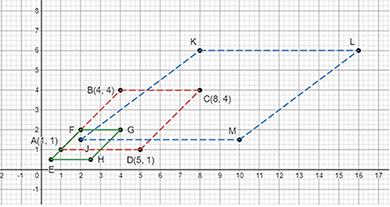
65. Draw a parallelogram ABCD on a graph paper with the coordinates given in Table I. Use this table to complete Tables II and III to get the coordinates of E, F, G, H and J, K, L, M.
Table I
Table II
Table III
66. Draw parallelograms EFGH and JKLM on the same graph paper.
Ans:
According to table I, the graph is
As per question, the complete table is
Table II
Table III
According to the above table, the graph is shown below:
67. Plot the points (2, 4) and (4, 2) on a graph paper, and then draw a line segment joining these two points. Extend the line segment on both sides to meet the coordinate axis. What are the coordinates of the points where this line meets the x -axis and the y-axis?
Ans:
Given, two points: (2, 4) and (4, 2) First plot the points on the graph paper. After that, draw a line segment that joins these two points. The graph is shown below:
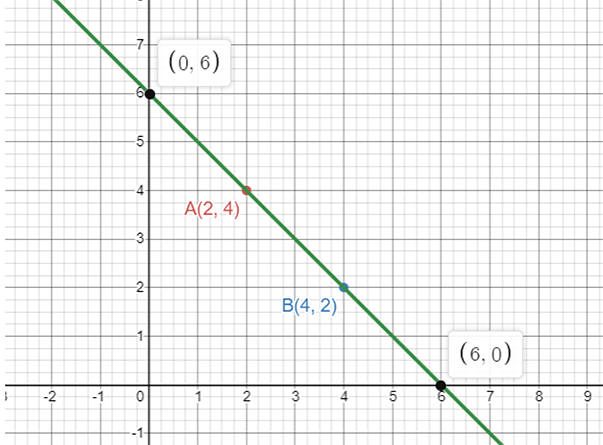
Coordinates of the point on y-axis,
The line segment meet will be form = (0, y)
So, the coordinates of the line segment = (0,6)
Coordinates of the point on x-axis,
The line segment meet will be form = (x, 0)
So, the coordinates of the line segment = (6, 0)
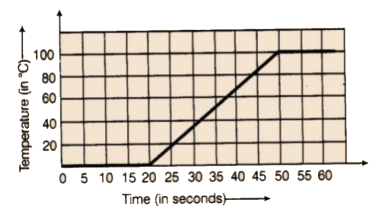
68. The following graph shows the change in temperature of a block of ice when heated. Use the graph to answer the following questions:
a) For how many seconds did the ice block have no change in temperature?
b) For how long was there a change in temperature?
c) After how many seconds of heating did the temperature become constant at 0°C?
d) What was the temperature after 25 seconds?
e) What will be the temperature after 1.5 minutes? Justify your answer.
Ans:
As per question,
a) First 20 seconds.
b) 30 seconds.
c) 50 seconds
d) 20°C
e) Temperature: 100°C. After observing the graph, temperature after heating (50 sec) remains constant at100°C. Thus, we can say that the temperature will be 0°C after 1.5 min.
69. The following graph shows the number of people present at a certain shop at different times. Observe the graph and answer the following questions.
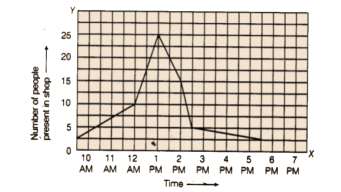
a) What type of a graph is this?
b) What information does the graph give?
c) What is the busiest time of day at the shop?
d) How many people enter the shop when it opens?
e) About how many people are there in the shop at 1:30 pm?
Ans:
As per question,
a) Line graph
b) The graph shows the number of people, who visited the store at a particular time.
c) Time: 1 PM
d) Number of people: 5 people
e) Number of people: 20 people
70. A man started his journey on his car from location A and came back. The given graph shows his position at different times during the whole journey.
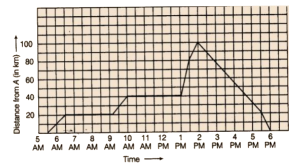
a) At what time did he start and end his journey?
b)What was the total duration of journey?
c) Which journey, forward or return, was of longer duration?
d)For how many hours did he not move?
e) At what time did he have the fastest speed?
Ans:
As per question,
a) Starting time of journey: 5:30 AM
Ending time of journey: 6 PM
b) Total duration of journey: 12:30 hours
c) Total duration of forward journey: 8:30 hours
Total duration of return journey: 4 hours
So, longer duration of journey: Forward journey
d) He did not move from 6:30 AM to 9:30 AM (3 hours) and 10 AM to 1 AM (3hours).
Total timing: 6 hours.
e) Timing of fastest speed: 1 PM
71. The following graph shows the journey made by two cyclists, one from town A to B and the other from town B to A.
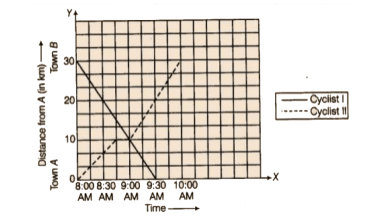
a) At what time did cyclist II rest? How long did the cyclist rest?
b) Was cyclist II cycling faster or slower after the rest?
c) At what time did the two cyclists meet?
d) How far had cyclist II travelled when he met cyclist I?
e) When cyclist II reached town A, how far was cyclist I from town B?
Ans:
As per question,
a) Timing: 8:45 and Time period: 15 minutes.
b) Cyclist II was cycling faster after the rest. The distance covered by him: 20 km in 1 hour.
c) Timing: 9:00 AM
d) Travelled distance: 20 km
e) Distance of cyclist I from town B: 10 km
72. Ajita starts off from home at 07.00 hours with her father on a scooter that goes at a uniform speed of 30 km/h and drops her at her school after half an hour. She stays in the school till 13.30 hours and takes an auto rickshaw to return home. The rickshaw has a uniform speed of 10 km/h. Draw the graph for the above situation and also determine the distance of Ajita’s school from her house.
Ans:
As per question,
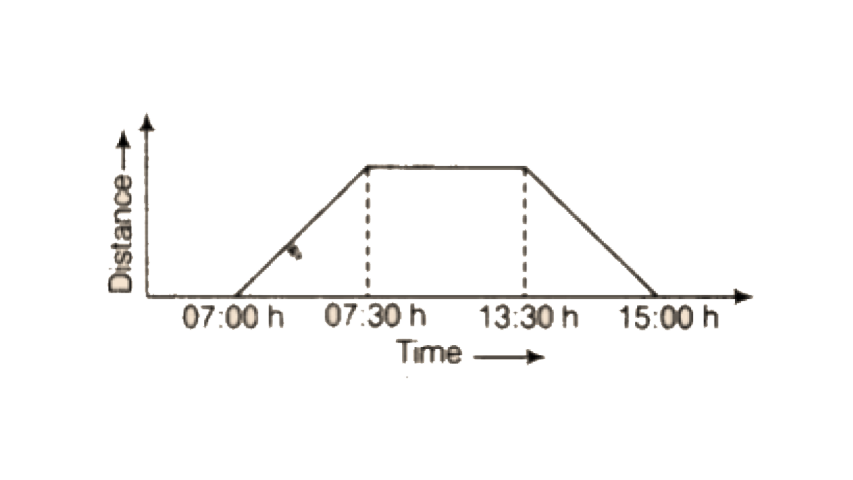
Given, speed (scooter) of ajita’s father = 30 km/hr
To drop ajita to her school, the taken time = 30 minutes
So, the distance between ajita’s home and her school
= 30 × (1/2) = 15 km
We know that distance = speed × time
So, in 1-minute, total covered distance = 15 ÷ 30
= 0.5 km = 500m
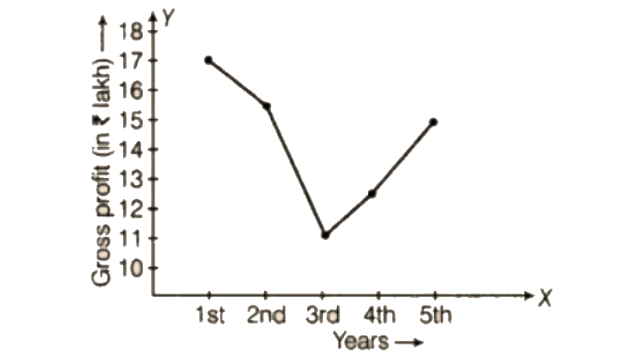
73. Draw the line graph using a suitable scale to show the annual gross profit of a company for a period of five years.
Ans:
In the shown graph the x-axis represents years and the y-axis represents gross profit.
So, as per given data in question the line graph is shown below:
The following chart gives the growth in height in terms of percentage of full height of boys and girls with their respective ages.
74. Draw the line graph of the above data on the same sheet and answer the following questions.
a) In which year both the boys and the girls achieve their maximum height?
b) Who grows faster at puberty (14 years to 16 years of age)?
Ans:
a) As per question, the graph is shown below
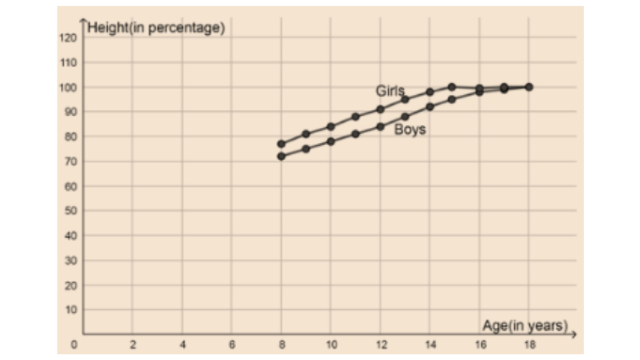
b) Girls
75. The table shows the data collected for Dhruv’s walking on a road.
a) Plot a line graph for the given data using a suitable scale.
b) In what time periods did Dhruv make the most progress?
Ans:
As per question, the graph is shown below,
Progress made by dhruv: from 0 to 5 minutes and 5 to 10 minutes.
76. Observe the given graph carefully and complete the table given below.
Ans:
By observing the given graph in question, the complete table is
77. This graph shows the percent of students who dropped out of school after completing High School. The point labelled A shows that, in 1996, about 4.7% of students dropped out.
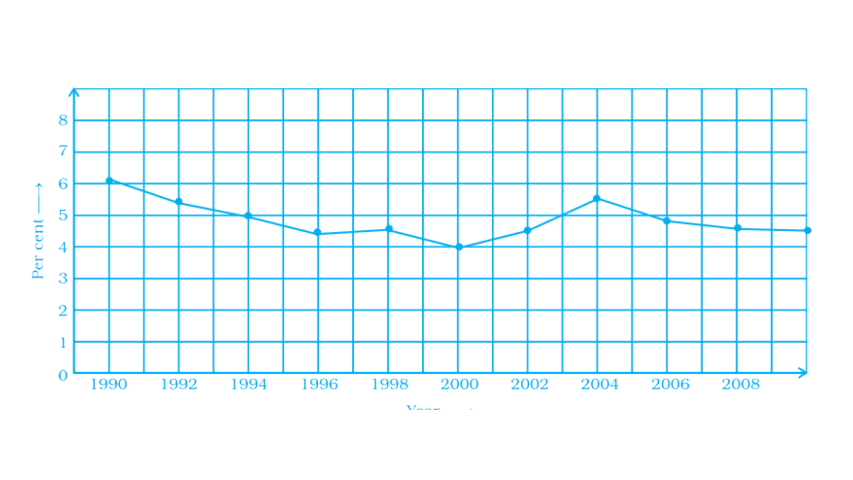
a) In which year was the dropout the highest? In which year was it the lowest?
b) When did the percent of students who dropped out of high school first fall below 5%?
c) About what percent of students dropped out of high school in 2007?
About what percent of students stayed in high school in 2008?
Ans:
As per question,
a) Highest dropout rate: year 1990 and lowest: year 2000.
b) The percent of students: 5%
c) Students dropped out of high school in 2007: 4.8% and students stayed in high school in 2008: 0.1%
78. Observe the toothpick pattern given below:
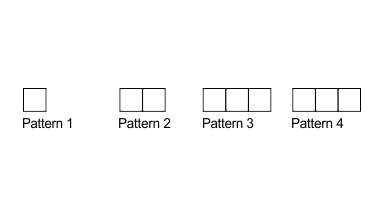
a) Imagine that this pattern continues. Complete the table to show the number of toothpicks in the first six terms.
b) Make a graph by taking the pattern numbers on the horizontal axis and the number of toothpicks on the vertical axis. Make the horizontal axis from 0 to 10 and the vertical axis from 0 to 30.
c) Use your graph to predict the number of toothpicks in patterns 7 and 8. Check your answers by actually drawing them.
d) Would it make sense to join the points on this graph? Explain.
Ans:
By arranging the given table,
a) The pattern and toothpicks are related as below,
1 → 4,
2 → 4 + 3 = 7
3 → 7 +3 = 10
4 → 10 + 3 =13
5 → 13 + 3 = 16
6 → 16 + 3 =19
So, the complete table is
b) The graph of the calculated table is given below:
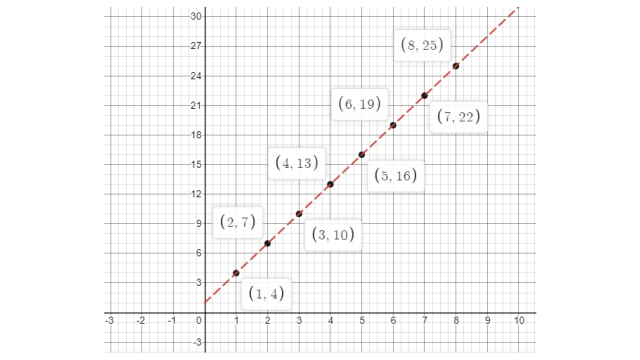
c) The graph shows y = 3x + 1 pattern
So, if x = 7 then y = (3 × 7) + 1 = 22
And if x = 8 then y = (3 × 8) + 1 = 25
Now, the table will be,
d) Yes, it is true that x and y follows the pattern y = 3x + 1
79. Consider this input/output table.
a) Graph the values from the table by taking Input along horizontal axis from 0 to 8 and Output along vertical axis from 0 to 24.
b) Use your graph to predict the outputs for inputs of 3 and 8.
Ans:
a) As per given data the graph is shown below:
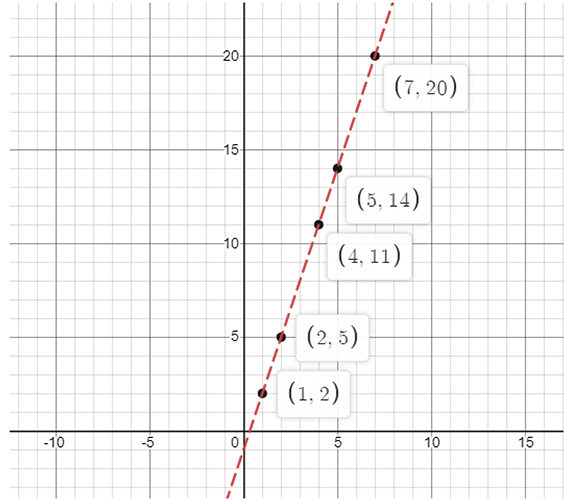
The above graph follows the pattern: y = 3x – 1.
b) We know that the pattern is y = 3x – 1
So, if x = 3, then y = 3 × 3 – 1 = 8
And x = 8, then y = 3 × 8 – 1 = 23
Now, the table is
80. This graph shows a map of an island just off the coast of a continent. The point labelled B represents a major city on the coast. The distance between grid lines represents 1 km.
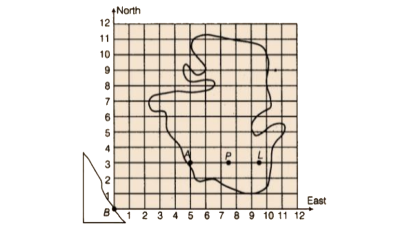
Point A represents a resort that is located 5 km East and 3 km North of Point B. The values 5 and 3 are the coordinates of Point
A. The coordinates can be given as the ordered pair (5, 3), where 5 is the horizontal coordinate and 3 is the vertical coordinate.
i) On a copy of the map, mark the point that is 3 km East and 5 km North of Point B and label it S. Is Point S in the water or on the island?Is Point S in the same place as Point A?
ii) Mark the point that is 7 km east and 5 km north of Point B and label it C. Then mark the point that is 5 km east and 7 km north of Point B and label it D. Are Points C and D in the same place? Give the coordinates of Points C and D.
iii) Which point is in the water, (2, 7) or (7, 2)? Mark the point which is in water on your map and label it E.
iv) Give the coordinates of two points on the island that are exactly 2 km from Point A.
v) Give the coordinates of the point that is halfway between Points L and P.
vi) List three points on the island with their x-coordinates greater than 8.
vii) List three points on the island with a y-coordinate less than 4.
Ans:
As per question,
i) No, according to the given graph it is not in the same place. The point is in water.
ii) No, according to the given graph they are not in the same place. The coordinates of ‘C’ are (7, 5) and ’D’ are (5,7).
iii) Point in water: (2, 7)
iv) The coordinates are: (7, 3) and (5, 5)
v) The coordinates of the point: (8.5, 3)
vi) The three points are: (9, 4) (10, 4) (11, 5)
vii) The three points are: (5, 3) (6, 2) (7, 2)
Note: answers of option (vi) and (vii) may vary from student to student.
81. As part of his science project, Prithvi was supposed to record the temperature every hour one Saturday from 6 am to midnight. At noon, he was taking lunch and forgot to record the temperature. At 8:00 pm, his favourite show came on and so forgot again. He recorded the data collected on a graph sheet as shown below.
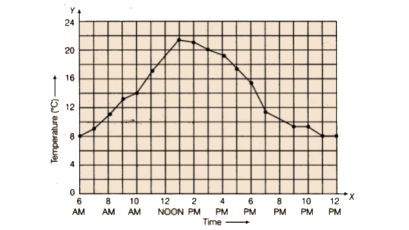
a) Why does it make sense to connect the points in this situation?
b) Describe the overall trend, or pattern, in the way the temperature changes over the time period shown on the graph.
c) Estimate the temperature at noon and 8 pm.
Ans:
a) By doing this, it is simpler to understand a change in the temperature.
b) Initially, the temperature at 6 AM: 8°C This temperature started increasing strictly till 1 PM and after that, it decreased to 8°C till 12 PM.
c) At 12 PM, 19°C and also at 8 PM, 10°C
82. The graph given below compares the price (in Rs) and weight of 6 bags (in kg) of sugar of different brands A, B, C, D, E, F.
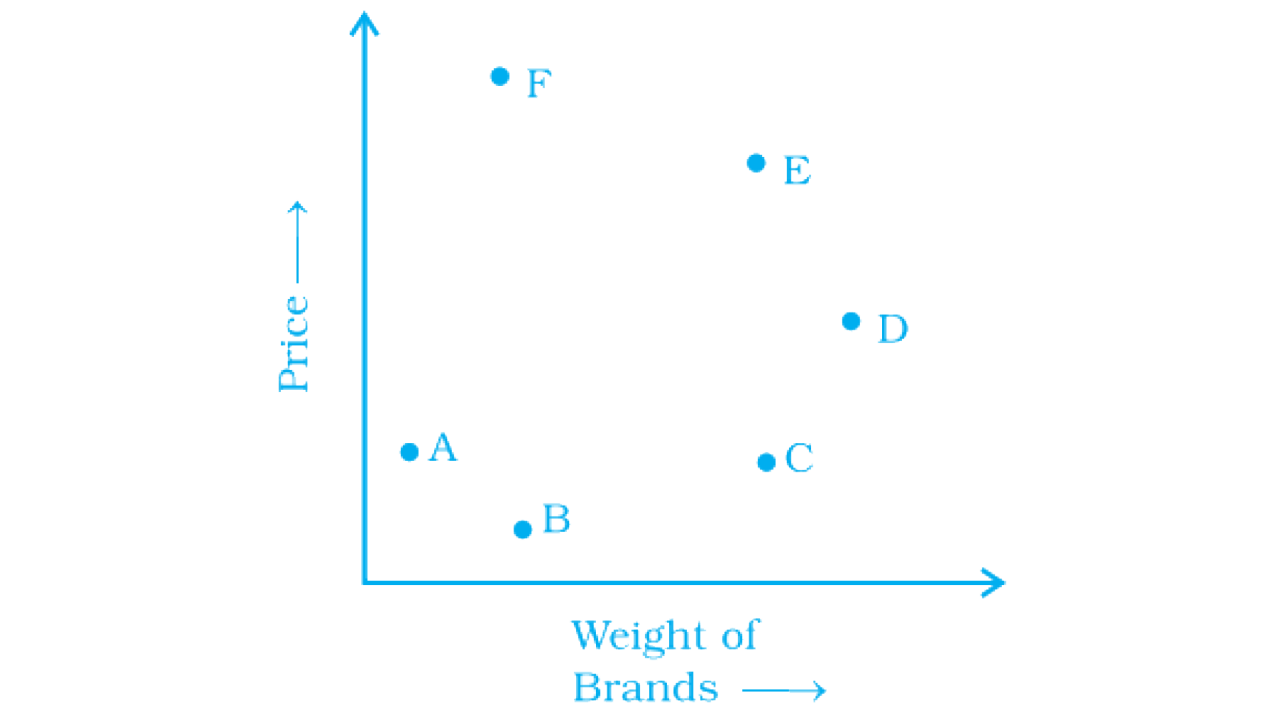
a) Which brand(s) costs/cost more than Brand D?
b) Bag of which brand of sugar is the heaviest?
c) Which brands weigh the same?
d) Which brands are heavier than brand B?
e) Which bag is the lightest?
f) Which bags are of the same price?
Ans:
As per question,
a) Brands: E and F
b) Brand: D
c) Brands: S and F; E and C
d) Brands: C, D, E
e) Brand: A
f) Brands: A and C
83. The points on the graph below represent the height and weight of the donkey, dog, crocodile, and ostrich shown in the drawing.
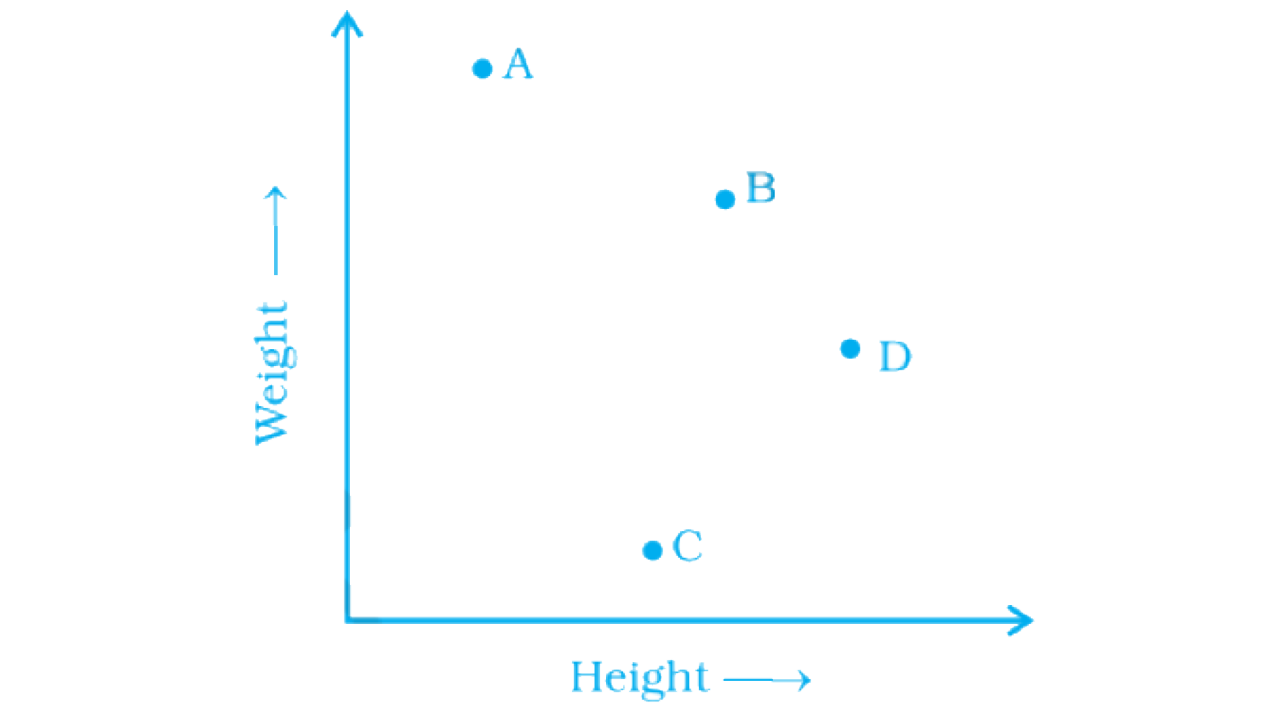
a) What are the two variables represented in the graph?
b) Which point represents each animal? Explain.
Ans:
As per questions,
a) The two variables: Height and weight
b) The points that represents each animal are
Point A: Crocodile
Point B: Donkey
Point C: Dog
Point D: Ostrich
84. The two graphs below compare Car A and Car B. The left graph shows the relationship between age and value. The right graph shows the relationship between size and maximum speed.
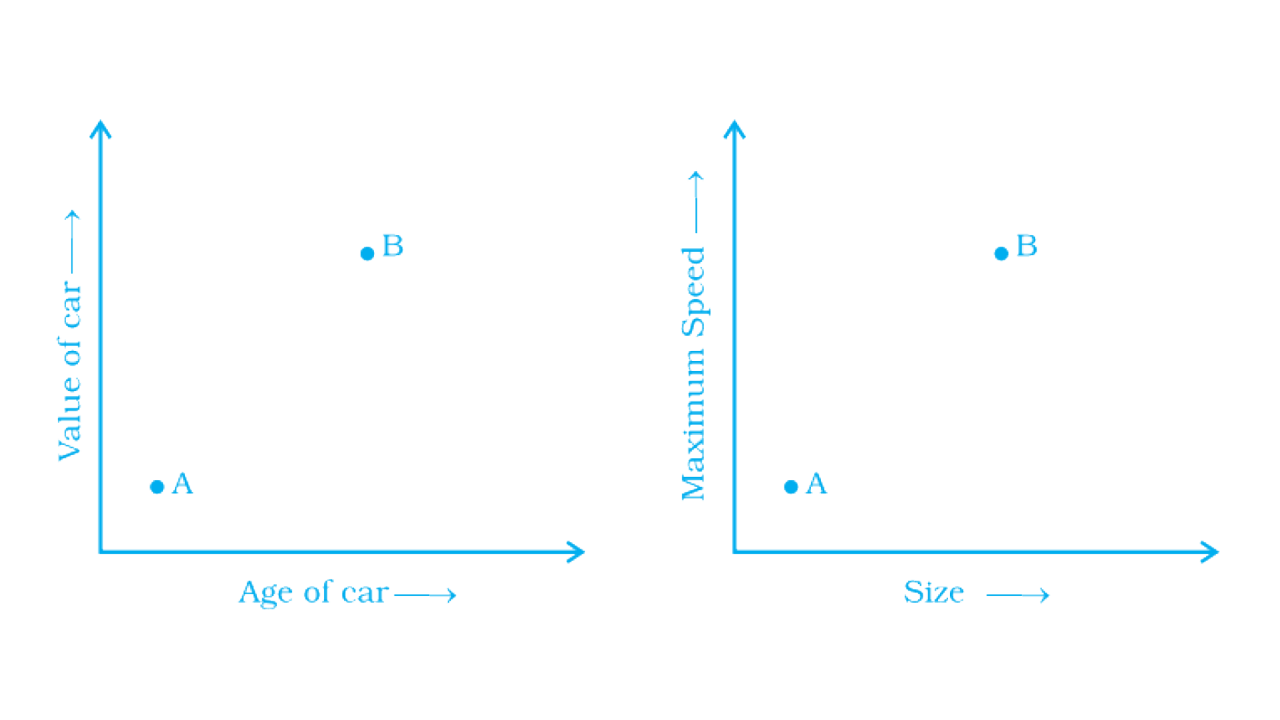
Use the graphs to determine whether each statement is true or false, and explain your answer.
a) The older car is less valuable.
b) The faster car is larger.
c) The larger car is older.
d) The faster car is older.
e) The more valuable car is slower.
Ans:
As per question,
a) The given statement is false. The older car is B and an older car is more valuable than A.
b) The given statement is true because the speed increases with the size of the car.
c) The given statement is true because B is the both the larger and an older car.
d) The given statement is true because B is the both the faster andan older car.
e) The given statement is false because b is more valuable than A.
Also, it is faster as compared to A.
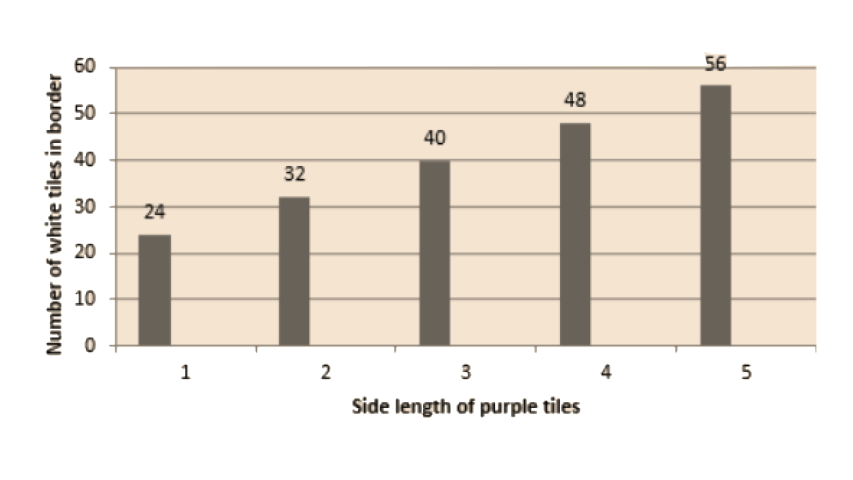
85. Sonal and Anmol made a sequence of tile designs from square white tiles surrounding one square purple tile. The purple tiles come in many sizes. Three of the designs are shown below.
a) Copy and complete the table
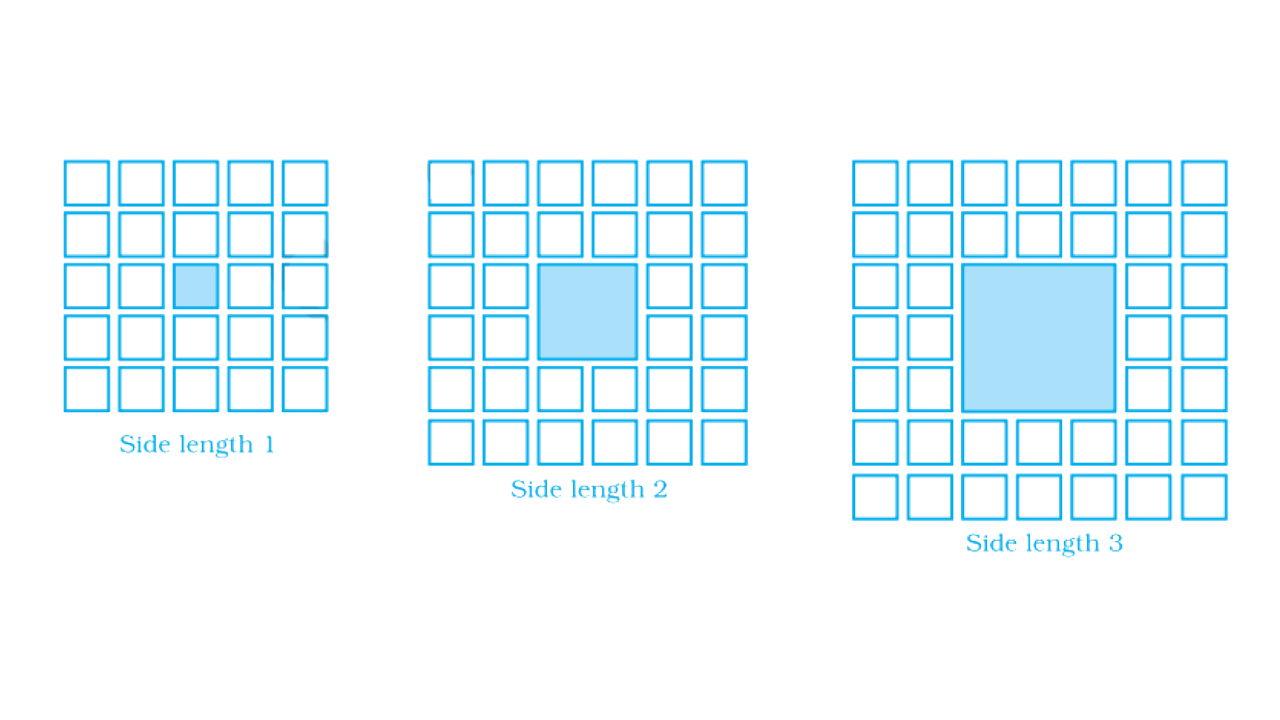
b) Draw a graph using the first five pairs of numbers in your table.
c) Do the points lie on a line?
Ans:
As per question,
a) The complete table is:
b) The graph is:
c) No.
86. Sonal and Anmol then made another sequence of the designs. Three of the designs are shown below.
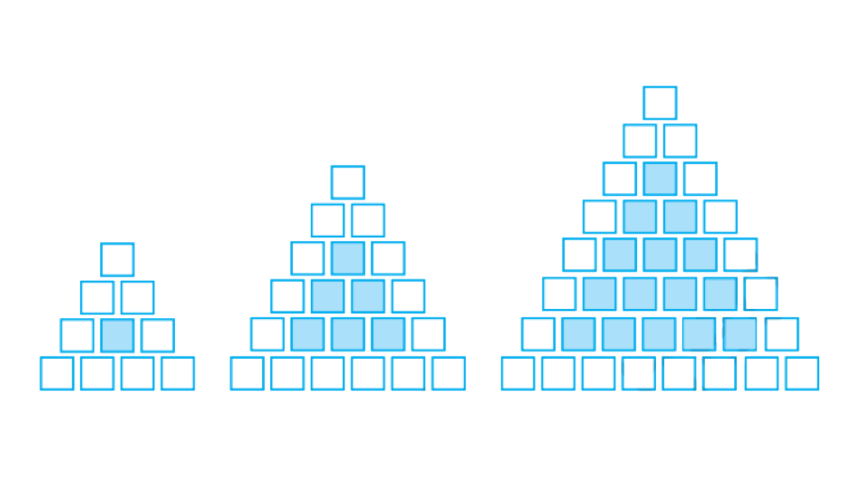
Complete the table.
87. Draw a graph of rows and number of white tiles. Draw another graph of the number of rows and the number of purple tiles. Put the number of rows on the horizontal axis. Which graph is linear?
Ans:
a) Complete the table.
b) The graph is:
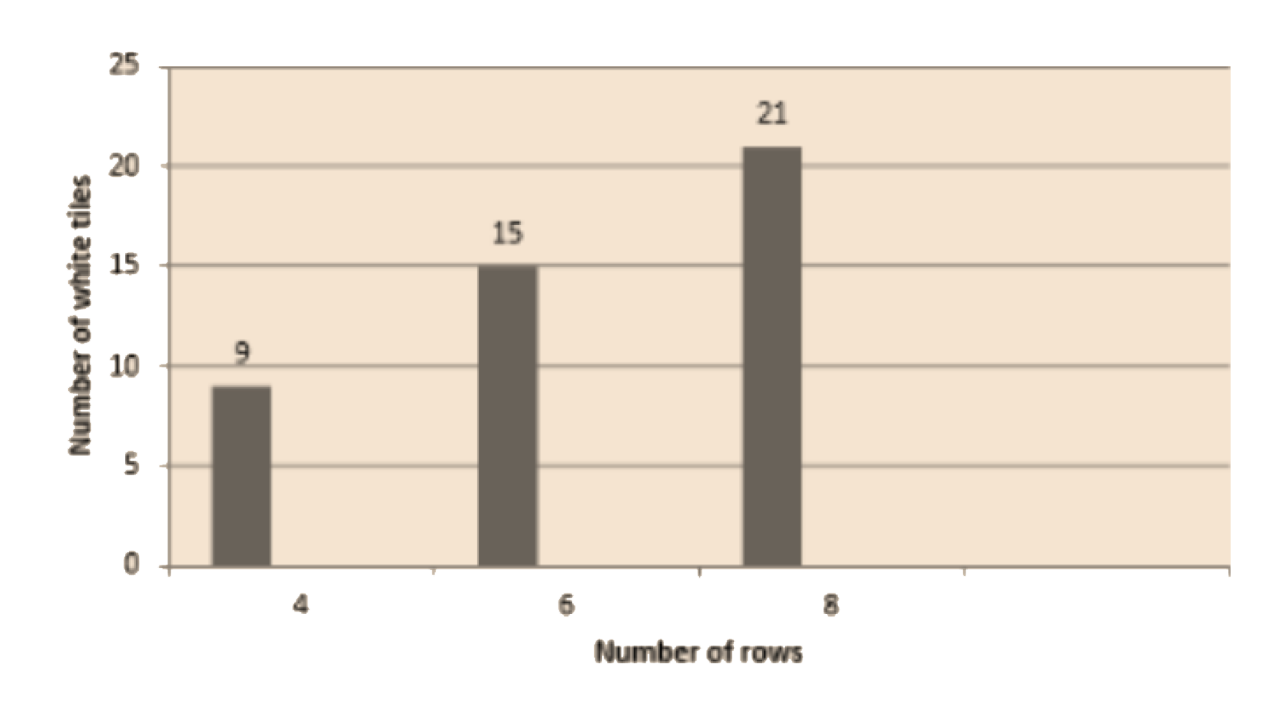
c) The graph is:
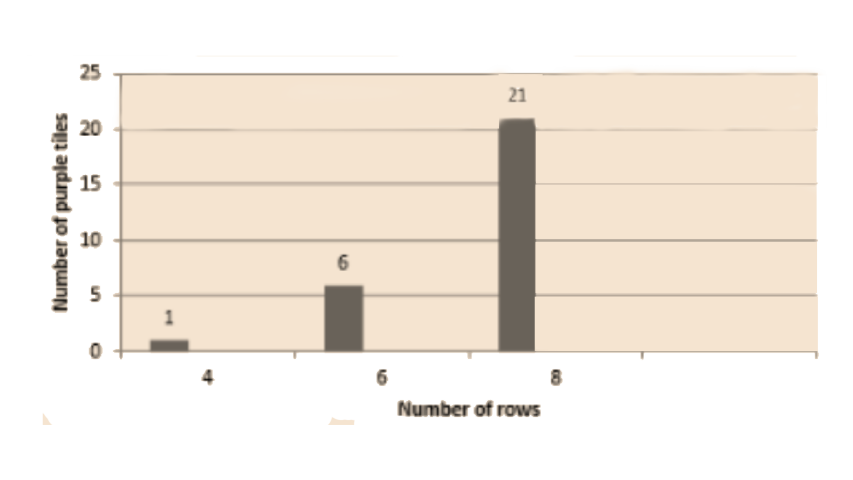
d) Not a single graph is linear.
..

FAQs on NCERT Exemplar for Class 8 Maths Solutions Chapter 12 Introduction to Graphs
1. How many types of graphs there are in Class 8 Math and explain them?
There are many ways to represent data in a graphical manner, which are used according to the situation and type of data provided. Some of which are discussed below:
Bar Graph - While comparing the classification of data, a Bar graph is used. It is called a bar graph as it consists of rectangular, vertical, and horizontal bars.
Pie Chart - when you need to show the comparison between different parts of a whole, the Pie chart is most suitable.
Histogram - Histogram looks just like Bar graphs, but is used to represent data into ranges.
Linear Graph - Linear graph is ideal to present the changes occurring in data over some time.
2. Why should one refer to NCERT Exemplar solutions of Chapter 12 Introduction to Graphs?
Students should refer to the NCERT Exemplar solution of Chapter 12 (Introduction to Graphs) of Class 8 by Vednatu, as these solutions are prepared with the utmost care, to make it easier for the student to understand the reasoning and logic behind every answer. These solutions are created following the latest guidelines of CBSE, so the students can get familiar with the exam pattern and score better.
For the sake of convenience, Students can download these solutions in PDF format and can review them at any time and anywhere, without the internet.
3. Give examples of the use of graphs in real life?
Business uses graphs for the comparisons of two quantities, and how they get affected when one of them is changed.
In medical science, graphs are used to compare the effectiveness of different medicines
Graphs are used to plan the budget, both at an individual level or a country level. It became easier to find mistakes and topics that need improvement.
Graphs are used in various kinds of research. In general, data collected in research is huge, so easier visual representation is needed.
Graphs are also used to represent various statistical data of many different projects.
4. What are the Important points to remember in the chapter introduction of graphs?
X coordinates for a point are the points’ distance from the y-axis.
Y coordinates for a point are the points’ distance from the x-axis.
Coordinates at origin are (0,0)
For fixing a point on the graph, x and y coordinates are required.
If a line graph is a complete unbroken line, then it is called a linear graph.
A pie graph is used, when it is needed to compare parts of a whole
Graphs represent a relationship between two or more variables.
5. What is the Cartesian plane?
The Cartesian plane is named after a French Mathematician named Rene Descartes, who invented this system and formalized its use in modern Mathematics. The cartesian plane is a rectangular two-dimensional coordinate plane, which is defined by the intersection of two perpendicular lines, named X-axis (Horizontal) and y-axis (Vertical). Where perpendicular lines meet is called the origin and given the coordinates (0,0). With the help of these lines, one can easily describe the location of a point lying within this plane.