


You are growing a bacterial population in a laboratory flask with a flow-through system that continuously replaces the old culture medium with a fresh medium without removing any bacteria. Which of the following graphs best predicts the growth of this population over time?
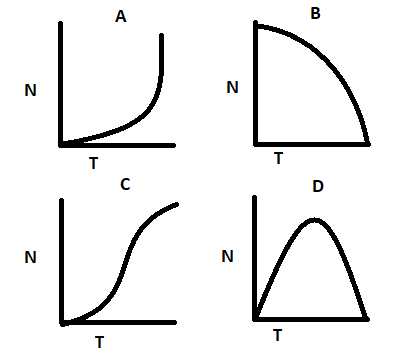
A. A
B. D
C. B
D. C
Answer
405k+ views
Hint: The process of a population's rate of growth declining as the amount of individuals in the population increases is referred to as logistic population growth. The population growth rate is a measurement of how the size of a population alters over time, and it is affected by population size, birth rate, and death rate. When a population's growth rate slows as the number of people increases, this is referred to as logistic population growth.
Complete step by step solution:
A population is a community of individuals belonging to the same species who live in the same area. The population growth rate is a measurement of how the size of a population alters over time, and it is affected by population size, birth rate, and death rate. As long as sufficient resources are available, the number of people in a population will grow over time, resulting in a positive growth rate. Most populations, however, cannot continue to grow indefinitely considering that they will eventually exhaust their supply of water, food, sunlight, space, and other resources. As these resources deplete, population growth will begin to slow. When a population's growth rate slows as the number of people increases, this is referred to as logistic population growth.
Logistic growth can also be viewed as a mathematical formula. The population growth rate is evaluated in terms of the number of people in a population (N) over time (t). The population growth rate is expressed as $\left ( \dfrac{dN}{dt} \right )$. The d simply represents change. The carrying capacity is represented by K, and the maximum per capita growth rate for a population is represented by r. The term "per capita" refers to an individual, and the per capita growth rate takes into account the number of births and lives lost in a population. The logistic growth equation indicates that K and r in a population do not change over time.
$\dfrac{dN}{dt}=rN\left ( \dfrac{K-N}{K} \right )$
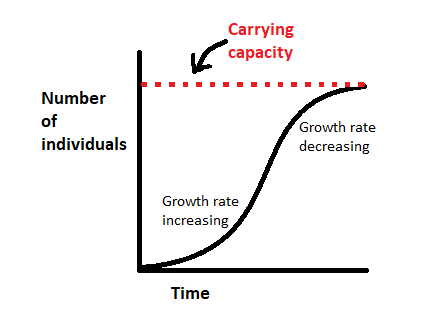
A graph of a population undergoing logistic population growth will have a distinctive S-shaped curve. When there are just a few people, the population grows slowly. When there are more people, the population grows faster. Finally, having a large population causes growth to slow since resources are limited. A population will continue to grow in logistic growth until it attains carrying capacity, which refers to the maximum number of people the environment can support.
Hence, option D is correct.
Note:
When there is not only a breeding population of significant size but also plenty of available space and other resources in the environment, new individuals are added to the population most rapidly at intermediate population sizes.
Complete step by step solution:
A population is a community of individuals belonging to the same species who live in the same area. The population growth rate is a measurement of how the size of a population alters over time, and it is affected by population size, birth rate, and death rate. As long as sufficient resources are available, the number of people in a population will grow over time, resulting in a positive growth rate. Most populations, however, cannot continue to grow indefinitely considering that they will eventually exhaust their supply of water, food, sunlight, space, and other resources. As these resources deplete, population growth will begin to slow. When a population's growth rate slows as the number of people increases, this is referred to as logistic population growth.
Logistic growth can also be viewed as a mathematical formula. The population growth rate is evaluated in terms of the number of people in a population (N) over time (t). The population growth rate is expressed as $\left ( \dfrac{dN}{dt} \right )$. The d simply represents change. The carrying capacity is represented by K, and the maximum per capita growth rate for a population is represented by r. The term "per capita" refers to an individual, and the per capita growth rate takes into account the number of births and lives lost in a population. The logistic growth equation indicates that K and r in a population do not change over time.
$\dfrac{dN}{dt}=rN\left ( \dfrac{K-N}{K} \right )$
A graph of a population undergoing logistic population growth will have a distinctive S-shaped curve. When there are just a few people, the population grows slowly. When there are more people, the population grows faster. Finally, having a large population causes growth to slow since resources are limited. A population will continue to grow in logistic growth until it attains carrying capacity, which refers to the maximum number of people the environment can support.
Hence, option D is correct.
Note:
When there is not only a breeding population of significant size but also plenty of available space and other resources in the environment, new individuals are added to the population most rapidly at intermediate population sizes.
Recently Updated Pages
Master Class 12 Business Studies: Engaging Questions & Answers for Success
Master Class 12 Biology: Engaging Questions & Answers for Success
Master Class 12 Chemistry: Engaging Questions & Answers for Success
Class 12 Question and Answer - Your Ultimate Solutions Guide
Master Class 11 Social Science: Engaging Questions & Answers for Success
Master Class 11 English: Engaging Questions & Answers for Success
Trending doubts
Which are the Top 10 Largest Countries of the World?
One Metric ton is equal to kg A 10000 B 1000 C 100 class 11 physics CBSE
What is the Full Form of ICSE / ISC ?
Explain the Treaty of Vienna of 1815 class 10 social science CBSE
Draw a labelled sketch of the human eye class 12 physics CBSE
What is BLO What is the full form of BLO class 8 social science CBSE