


Write a short note on a Multiple Bar Diagram.
Answer
566.7k+ views
Hint: We first explain the concept of Multiple Bar Diagram. We also explain the conditions in which we use the Multiple Bar Diagram. Then we take examples to understand the concept better.
Complete step-by-step solution:
A multiple bar graph shows the relationship between different values of data. Each data value is represented by a column in the graph. In a multiple bar graph, multiple data points for each category of data are shown with the addition of columns. These are used also for two or more sets of interrelated data.
The labels are kept in the X-axis and their respective frequencies are used in the Y-axis. These frequencies are plotted in the column section.
We explain the diagram with the use of an example.
We take arbitrary values for the imports and exports of India (values in crores) for the years 1991 to 1994.
We try to place the values in a Multiple Bar Diagram.
Note: Although it is used for most of the relational cases, it has some drawbacks like it often require additional explanation. It also fails to expose key assumptions, causes, impacts and patterns. can be easily manipulated to give false impressions.
Complete step-by-step solution:
A multiple bar graph shows the relationship between different values of data. Each data value is represented by a column in the graph. In a multiple bar graph, multiple data points for each category of data are shown with the addition of columns. These are used also for two or more sets of interrelated data.
The labels are kept in the X-axis and their respective frequencies are used in the Y-axis. These frequencies are plotted in the column section.
We explain the diagram with the use of an example.
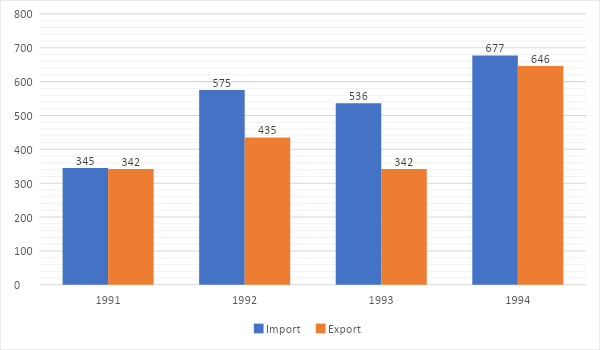
We take arbitrary values for the imports and exports of India (values in crores) for the years 1991 to 1994.
| Years | Imports | Exports |
| 1991 | 345 | 342 |
| 1992 | 575 | 435 |
| 1993 | 536 | 342 |
| 1994 | 677 | 646 |
We try to place the values in a Multiple Bar Diagram.
Note: Although it is used for most of the relational cases, it has some drawbacks like it often require additional explanation. It also fails to expose key assumptions, causes, impacts and patterns. can be easily manipulated to give false impressions.
Recently Updated Pages
Master Class 9 General Knowledge: Engaging Questions & Answers for Success
Master Class 9 Maths: Engaging Questions & Answers for Success
Master Class 9 Science: Engaging Questions & Answers for Success
Master Class 9 English: Engaging Questions & Answers for Success
Master Class 9 Social Science: Engaging Questions & Answers for Success
Class 9 Question and Answer - Your Ultimate Solutions Guide
Trending doubts
Difference Between Plant Cell and Animal Cell
Fill the blanks with the suitable prepositions 1 The class 9 english CBSE
What is pollution? How many types of pollution? Define it
Name 10 Living and Non living things class 9 biology CBSE
What is the full form of pH?
On an outline map of India show its neighbouring c class 9 social science CBSE