


With the help of flow-chart exhibit the events of eutrophication.
Answer
601.5k+ views
Hint: Eutrophication is the excessive richness of nutrients in water. This is due to the run-off from the land. This arises the oversupply of nitrate and phosphate nutrients. This always occurs naturally. These prevail in external nutrient loads. Here is the flowchart to exhibit the events of eutrophication. Through this, the process of eutrophication can be analyzed.
Complete answer:
Eutrophication is the process in which it leads to plentiful growth of plant life. This leads to increase in production of algae and the macrophytes. Algal blooms are very much present in this process and this is so harmful to humans. The roots here are paralytic and neurotoxic. This can be prevented by the inflow of nutrients in water bodies. It also prevents the biodiversity of the water body. These become the dead zones of supporting life. The following is the flow-chart of the process eutrophication. They are as follows:
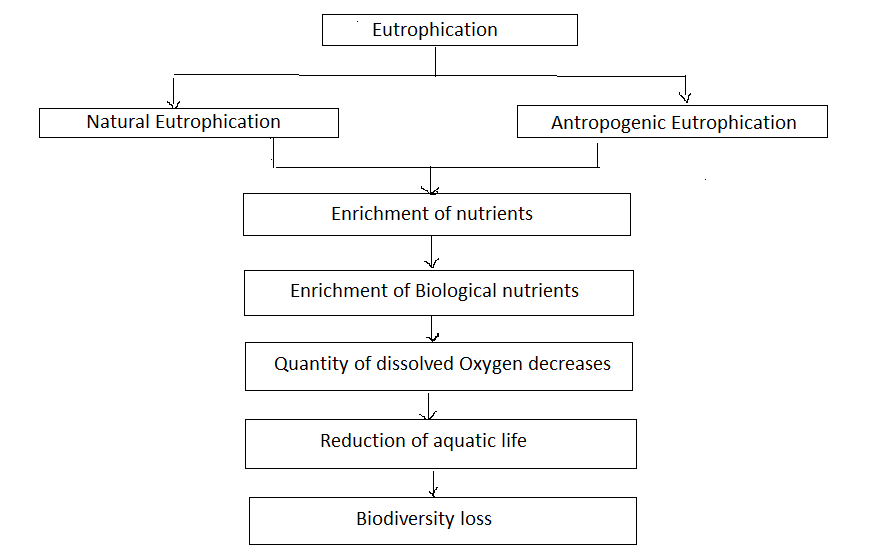
This is the flowchart involved in eutrophication. Phytoplankton grow very much better in this process. These species are very much toxic and edible. The population of some of the fishes are lowered. This also affects the lakes in their vertical structure and implications for the living organisms.
Note: Eutrophication can lead to the threat of many plants and animals. One of the adverse effects in this process is depletion of oxygen level. This is a mechanism in which the lakes obtain nutrients more abundant and shallower. This sustains the living organisms. This is the natural process in which it can promote the growth of algae in the aqueous bodies.
Complete answer:
Eutrophication is the process in which it leads to plentiful growth of plant life. This leads to increase in production of algae and the macrophytes. Algal blooms are very much present in this process and this is so harmful to humans. The roots here are paralytic and neurotoxic. This can be prevented by the inflow of nutrients in water bodies. It also prevents the biodiversity of the water body. These become the dead zones of supporting life. The following is the flow-chart of the process eutrophication. They are as follows:
This is the flowchart involved in eutrophication. Phytoplankton grow very much better in this process. These species are very much toxic and edible. The population of some of the fishes are lowered. This also affects the lakes in their vertical structure and implications for the living organisms.
Note: Eutrophication can lead to the threat of many plants and animals. One of the adverse effects in this process is depletion of oxygen level. This is a mechanism in which the lakes obtain nutrients more abundant and shallower. This sustains the living organisms. This is the natural process in which it can promote the growth of algae in the aqueous bodies.
Recently Updated Pages
Master Class 12 Economics: Engaging Questions & Answers for Success
Master Class 12 English: Engaging Questions & Answers for Success
Master Class 12 Social Science: Engaging Questions & Answers for Success
Master Class 12 Maths: Engaging Questions & Answers for Success
Master Class 12 Physics: Engaging Questions & Answers for Success
Master Class 9 General Knowledge: Engaging Questions & Answers for Success
Trending doubts
Which are the Top 10 Largest Countries of the World?
Draw a labelled sketch of the human eye class 12 physics CBSE
Differentiate between homogeneous and heterogeneous class 12 chemistry CBSE
Sulphuric acid is known as the king of acids State class 12 chemistry CBSE
Why is the cell called the structural and functional class 12 biology CBSE
Draw ray diagrams each showing i myopic eye and ii class 12 physics CBSE