


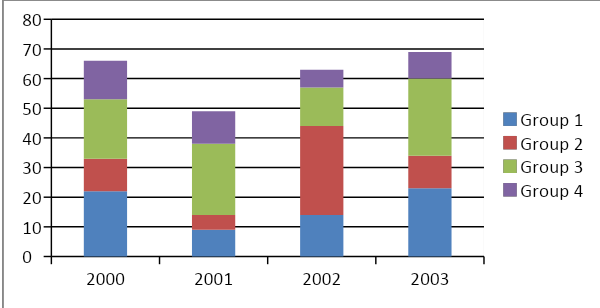
Which year should be the best result in group exams (in terms of percentage of students who cleared)? Here group $ 1 $ , group $ 2 $ , group $ 3 $ cleared but group $ 4 $ failed in all years.
$ \begin{align}
& (a)2000 \\
& (b)2001 \\
& (c)2002 \\
& (d)2003 \\
\end{align} $
Answer
591.9k+ views
Hint: In this question, we are given a stack bar graph in which performance of four groups is shown. Group $ 1 $ , group $ 2 $ and group $ 3 $ have students who passed but group $ 4 $ failed in all the years. We have to tell which year showed the best result in terms of percentage of students who cleared. For this, we will first calculate the pass percentage for each year and then compare them. For calculating pass percentage, we will use formula as –
Pass percentage for any year $ =100\times \dfrac{students~who~passed~in~that~year}{total~students~that~appeared~that~year} $
Complete step-by-step answer:
As we can see from graph, we are given number of passed students as -
For year $ 2000 $ , passed students $ =54 $
For year $ 2001 $ , passed students $ =39 $
For year $ 2002 $ , passed students $ =57 $
For year $ 2003 $ , passed students $ =70 $
Also, we can observe and determine total students appearing in the group exams, which is given as –
For year $ 2000 $ , total students $ =66 $
For year $ 2001 $ , total students $ =49 $
For year $ 2002 $ , total students $ =62 $
For year $ 2003 $ , total students $ =79 $
Now we can calculate the pass percentage of students who have cleared for each year. Since, percentage is given as $ =100\times \dfrac{students~who~passed~}{total~students~that~appeared~} $
Therefore,
For year $ 2000 $ , pass percentage $ =\dfrac{54}{66}\times 100=81.81% $
For year $ 2001 $ , pass percentage \[=\dfrac{39}{49}\times 100=79.59%\]
For year $ 2002 $ , pass percentage $ =\dfrac{57}{62}\times 100=91.9% $
For year $ 2003 $ , pass percentage $ =\dfrac{70}{79}\times 100=88.6% $
Comparing pass percentage of all four years, we get –
91.9% > 88.6% > 81.81% > 79.59% , which means $ 2002>2003>2000>2001 $
Hence, in the year $ 2002 $ students showed the best result in the group exam.
So, the correct answer is “Option (c)”.
Note: Students should know how to study graphs while solving these types of questions. Stacked bar graphs are a little difficult to understand but students should learn about them. Students should take care while noting values from the graph as the values are not written. Students should always remember formulas for calculating percentages.
Recently Updated Pages
Basicity of sulphurous acid and sulphuric acid are
Master Class 11 Business Studies: Engaging Questions & Answers for Success
Master Class 11 Computer Science: Engaging Questions & Answers for Success
Master Class 11 Economics: Engaging Questions & Answers for Success
Master Class 11 Social Science: Engaging Questions & Answers for Success
Master Class 11 English: Engaging Questions & Answers for Success
Trending doubts
The largest wind power cluster is located in the state class 11 social science CBSE
Explain zero factorial class 11 maths CBSE
Which among the following are examples of coming together class 11 social science CBSE
Can anyone list 10 advantages and disadvantages of friction
State the laws of reflection of light
Draw a diagram of a plant cell and label at least eight class 11 biology CBSE