


Which sample A or B has a shorter mean life?
Answer
518.7k+ views
Hint:Mean life, in radioactivity, average lifetime of all the nuclei of a particular unstable atomic species. This time interval may be thought of as the sum of the lifetimes of all the individual unstable nuclei in a sample, divided by the total number of unstable nuclei present.
Complete step-by-step solution:
The mean life of B is shorter than that of A
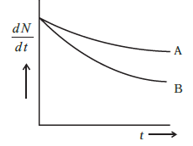
According to the Radioactive Decay Law states that the decay rate of a nucleus is given by the formula of
\[\dfrac{{dN}}{{dt}} = - \lambda N\]
Where,
\[\dfrac{{dN}}{{dt}}\] is the rate of decay of the nucleus with respect to time, \[\lambda \] is the decay rate constant of the nucleus and \[N\] is the number of nuclei present in the sample. As shown in the graph the X axis the decay rate and Y axis is the time of decay, now to point the decay rate constant in the graph we have to draw a slope on the curve of sample A and B like this
The slope of the A and B curve dedicates the decay rate constant of the sample A and B respectively. Now as for the mean life of the samples, the mean life formula is
\[\tau = \dfrac{1}{\lambda }\]
Where,\[\tau \]is the mean life and \[\lambda \] is the decay rate constant. So according to the diagram the mean life of A and B are given as
\[{\tau _A} = \dfrac{1}{{{\lambda _A}}},{\tau _B} = \dfrac{1}{{{\lambda _B}}}\]
\[{\lambda _A} < {\lambda _B}\]
\[{\tau _A} > {\tau _B}\]
Now as we can see in the above diagram (in the explanation), the value of decay rate constant of B and A is \[{\lambda _A} < {\lambda _B}\] (the flatter the curve the lesser is the slope therefore, the value of the slope of B is greater than A as the curve of B is greater than A) respectively. Hence, due to inverse proportionality the value of mean life of B is lesser than that of A.
Therefore, the mean life of B is shorter than that of A.
Note:We need to remember that radioactive decay (also known as nuclear decay, radioactivity, radioactive disintegration or nuclear disintegration) is the process by which an unstable atomic nucleus loses energy by radiation. A material containing unstable nuclei is considered radioactive.
Complete step-by-step solution:
The mean life of B is shorter than that of A
According to the Radioactive Decay Law states that the decay rate of a nucleus is given by the formula of
\[\dfrac{{dN}}{{dt}} = - \lambda N\]
Where,
\[\dfrac{{dN}}{{dt}}\] is the rate of decay of the nucleus with respect to time, \[\lambda \] is the decay rate constant of the nucleus and \[N\] is the number of nuclei present in the sample. As shown in the graph the X axis the decay rate and Y axis is the time of decay, now to point the decay rate constant in the graph we have to draw a slope on the curve of sample A and B like this
The slope of the A and B curve dedicates the decay rate constant of the sample A and B respectively. Now as for the mean life of the samples, the mean life formula is
\[\tau = \dfrac{1}{\lambda }\]
Where,\[\tau \]is the mean life and \[\lambda \] is the decay rate constant. So according to the diagram the mean life of A and B are given as
\[{\tau _A} = \dfrac{1}{{{\lambda _A}}},{\tau _B} = \dfrac{1}{{{\lambda _B}}}\]
\[{\lambda _A} < {\lambda _B}\]
\[{\tau _A} > {\tau _B}\]
Now as we can see in the above diagram (in the explanation), the value of decay rate constant of B and A is \[{\lambda _A} < {\lambda _B}\] (the flatter the curve the lesser is the slope therefore, the value of the slope of B is greater than A as the curve of B is greater than A) respectively. Hence, due to inverse proportionality the value of mean life of B is lesser than that of A.
Therefore, the mean life of B is shorter than that of A.
Note:We need to remember that radioactive decay (also known as nuclear decay, radioactivity, radioactive disintegration or nuclear disintegration) is the process by which an unstable atomic nucleus loses energy by radiation. A material containing unstable nuclei is considered radioactive.
Recently Updated Pages
Basicity of sulphurous acid and sulphuric acid are
Master Class 12 English: Engaging Questions & Answers for Success
Master Class 12 Social Science: Engaging Questions & Answers for Success
Master Class 12 Maths: Engaging Questions & Answers for Success
Master Class 12 Economics: Engaging Questions & Answers for Success
Master Class 12 Physics: Engaging Questions & Answers for Success
Trending doubts
Which are the Top 10 Largest Countries of the World?
Draw a labelled sketch of the human eye class 12 physics CBSE
Give 10 examples of unisexual and bisexual flowers
Coming together federation is practiced in A India class 12 social science CBSE
Write the formula to find the shortest distance between class 12 maths CBSE
Find the foot of the perpendicular from point232to class 12 maths CBSE