


Which of the following is the graph of a cubic function?
A)
B)
C)
D)
Answer
589.5k+ views
Hint:
Here we have to find the graph of the cubic function. The cubic function is a polynomial of degree three. Now simply we will find the graph of a simple cubic function $y = {x^3}$ and then compare the obtained graph with the graph given in the option.
Complete step by step solution:
Here we have to find the graph of the cubic function
Let us take a one cubic function.
$ \Rightarrow y = {x^3}$
Now, we will plot the graph of the following cubic function.
Plot the graph
Put when $x = 1$ then $y = 1$
When $x = 2$ then $y = 8$
When $x = 3$ then $y = 27$
By doing this procedure we will make a table,
Similarly repeat this process for the negative numbers
i.e. when $x = - 1$ then $y = - 1$ ;
when $x = - 2$ then $y = - 8$ ;
when $x = - 3$ then $y = - 27$
by continuing we get
Now, using the table 1 and table 2 we will plot the graph of cubic function
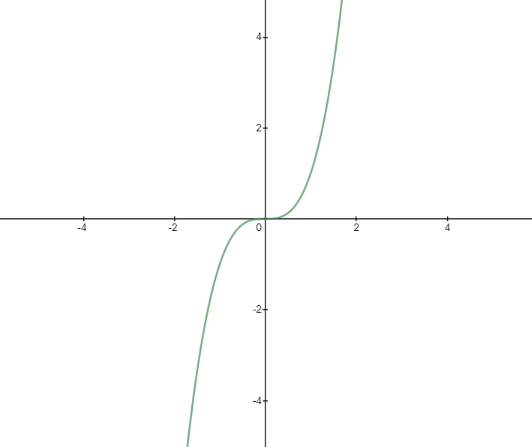
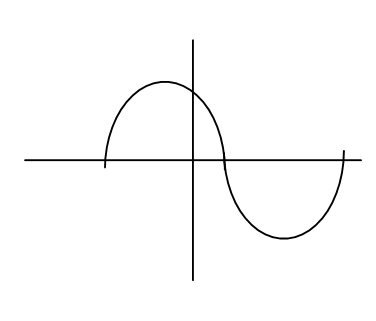
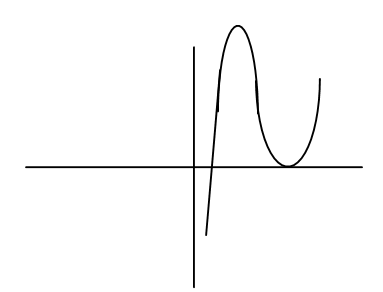
The above obtained graph is similar to the graph in option (B) and option (D) also the graph can be complicated if the variables in the cubic function increases i.e. $y = a{x^3} + b{x^2} + c$ .
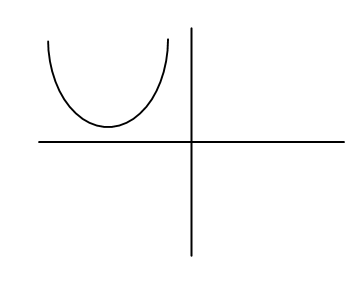
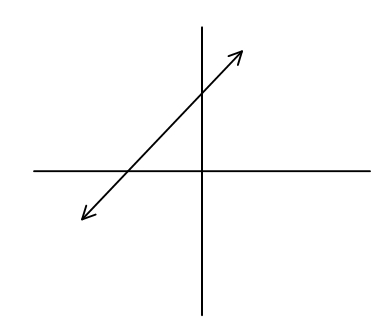
In option (C) the graph is a straight line that means option (C) represents the linear equation and option (A) represents the parabola. Option (D) is the correct answer.
Note:
In the above discussion we have plotted the graph of the cubic function. The graph obtained is not for all the cubic functions but the characteristic of the graph is the same for all cubic functions and also the graph of the cubic function would be symmetric in the opposite quadrant.
Here we have to find the graph of the cubic function. The cubic function is a polynomial of degree three. Now simply we will find the graph of a simple cubic function $y = {x^3}$ and then compare the obtained graph with the graph given in the option.
Complete step by step solution:
Here we have to find the graph of the cubic function
Let us take a one cubic function.
$ \Rightarrow y = {x^3}$
Now, we will plot the graph of the following cubic function.
Plot the graph
Put when $x = 1$ then $y = 1$
When $x = 2$ then $y = 8$
When $x = 3$ then $y = 27$
By doing this procedure we will make a table,
| X | 1 | 2 | 3 | 4 | 5 |
| y | 1 | 8 | 27 | 16 | 125 |
Similarly repeat this process for the negative numbers
i.e. when $x = - 1$ then $y = - 1$ ;
when $x = - 2$ then $y = - 8$ ;
when $x = - 3$ then $y = - 27$
by continuing we get
| x | -1 | -2 | -3 | -4 | -5 |
| y | -1 | -0 | -27 | -64 | -125 |
Now, using the table 1 and table 2 we will plot the graph of cubic function
The above obtained graph is similar to the graph in option (B) and option (D) also the graph can be complicated if the variables in the cubic function increases i.e. $y = a{x^3} + b{x^2} + c$ .
In option (C) the graph is a straight line that means option (C) represents the linear equation and option (A) represents the parabola. Option (D) is the correct answer.
Note:
In the above discussion we have plotted the graph of the cubic function. The graph obtained is not for all the cubic functions but the characteristic of the graph is the same for all cubic functions and also the graph of the cubic function would be symmetric in the opposite quadrant.
Recently Updated Pages
Basicity of sulphurous acid and sulphuric acid are
Master Class 11 Business Studies: Engaging Questions & Answers for Success
Master Class 11 Computer Science: Engaging Questions & Answers for Success
Master Class 11 Economics: Engaging Questions & Answers for Success
Master Class 11 Social Science: Engaging Questions & Answers for Success
Master Class 11 English: Engaging Questions & Answers for Success
Trending doubts
The largest wind power cluster is located in the state class 11 social science CBSE
Explain zero factorial class 11 maths CBSE
Which among the following are examples of coming together class 11 social science CBSE
Can anyone list 10 advantages and disadvantages of friction
State the laws of reflection of light
Draw a diagram of a plant cell and label at least eight class 11 biology CBSE