


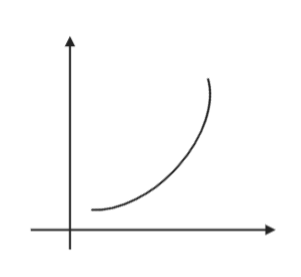
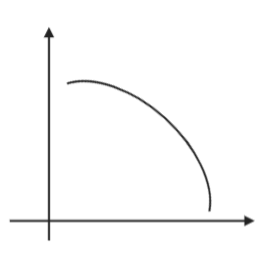
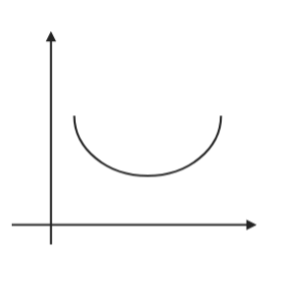
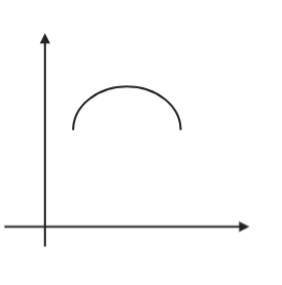
Which figure relates the trend of population growth of India from 1951-2001?
A)
B)
C)
D)
Answer
573.6k+ views
Hint: Scientific study of human population is called demography. The total number of individuals of a species present in a particular area at a given time together form a population. The population has specific characters different from the character of individuals. Populations evolve different strategies to maximize their reproductive fitness.
Complete answer:
(1) Population density: It is measured as the total number of individuals present in unit area or unit volume. The size of a population for any species constantly changes depending on various factors including food availability, predation pressure and weather change.
(2) Birth rate/ Fertility/ Natality: Birth rate is defined as total number of birth in a population with respect to total number of individuals of the population in a year. Birth rate is represented as per capita birth rate.
(3) Death rate: Death rate is defined as total number of deaths in a population with respect to total number of individuals of the population in a year.
(4) Growth rate: Growth rate refers to the percentage change of a specific variable within a specific time period. Intrinsic growth rate $(r) = b - d$.
Natality, Mortality, Immigration and emigration are the other basic processes responsible for fluctuation in population size under normal conditions.
Time of 1951-61: is named as population blast period. High birth rate, low death rate and better wellbeing facilities were explanations behind this.
Time of 1961-71: growth rate of population was 24.8%
Time of 1971-81: growth rate of population was 25%
Time of 1981-91: growth rate of population was 25.3%
Time of 1991-2001: growth rate of population was 26.9%.
Population of India expanded to 102.70 crore in 2001. The main reason behind this tremendous population over the most recent 50 years was a fall in death rate, progressed health facilities and no fall in birth rate. Subsequently, the concave shaped growth curve is obtained.
So, the right answer is option (C).
Note:
Natality and mortality are the most important factors influencing population size then other two factors that is immigration and emigration.
Some other characters of population are as Age and Sex structures. The Age structure of a given population refers to the proportion of individuals of different ages is an important aspect because many functional aspects of individuals are related to age. Age structure of the population can be depicted in the form of a pyramid diagram.
Recently Updated Pages
Master Class 12 Economics: Engaging Questions & Answers for Success
Master Class 12 Physics: Engaging Questions & Answers for Success
Master Class 12 English: Engaging Questions & Answers for Success
Master Class 12 Social Science: Engaging Questions & Answers for Success
Master Class 12 Maths: Engaging Questions & Answers for Success
Master Class 12 Business Studies: Engaging Questions & Answers for Success
Trending doubts
Which are the Top 10 Largest Countries of the World?
What are the major means of transport Explain each class 12 social science CBSE
Draw a labelled sketch of the human eye class 12 physics CBSE
Why cannot DNA pass through cell membranes class 12 biology CBSE
Differentiate between insitu conservation and exsitu class 12 biology CBSE
Draw a neat and well labeled diagram of TS of ovary class 12 biology CBSE