


What is the \[z\]-axis?
Answer
565.5k+ views
Hint: In this problem, we have to find the \[z\]-axis. We should know that, \[z\]-axis is the axis on the graph at least three dimensions that is usually drawn vertically and usually shows the range of values of a variable dependent on two other variables or the third independent variable. We can now see in brief about the \[z\]-axis.
Complete step-by-step solution:
We should know that a standard graph is like a 2D square. The length of the square is the x-axis and the height of the square is the y-axis and we can use these to plot two variables against each other (example Foot size and leg size).
Now we can analyse that, if we want to plot three variables against each other, then we can make 3D graphs such as cubes and cuboids. As before the length and the height are the x and y-axes, but the third dimension, the depth is called the \[z\]-axis.
We can now see how a \[z\]-axis will look like with the x-and y-axis.
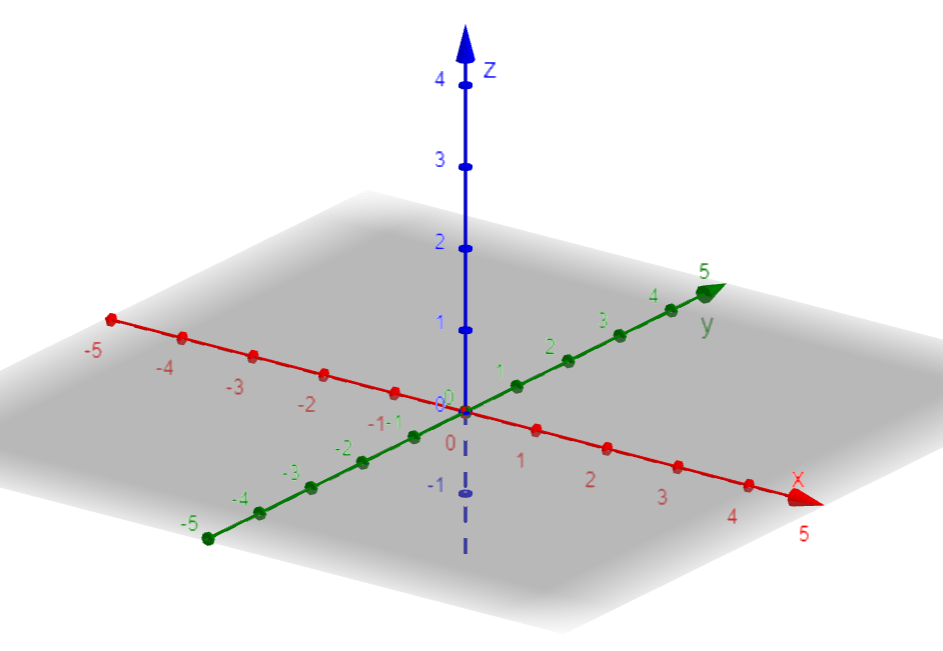
Note: Students should understand the importance of \[z\]-axis as it is used in 3D representations. We should also remember that, if we want to plot three variables against each other, then we can make 3D graphs such as cubes and cuboids. As before the length and the height are the x and y-axes, but the third dimension, the depth is called the \[z\]-axis.
Complete step-by-step solution:
We should know that a standard graph is like a 2D square. The length of the square is the x-axis and the height of the square is the y-axis and we can use these to plot two variables against each other (example Foot size and leg size).
Now we can analyse that, if we want to plot three variables against each other, then we can make 3D graphs such as cubes and cuboids. As before the length and the height are the x and y-axes, but the third dimension, the depth is called the \[z\]-axis.
We can now see how a \[z\]-axis will look like with the x-and y-axis.
Note: Students should understand the importance of \[z\]-axis as it is used in 3D representations. We should also remember that, if we want to plot three variables against each other, then we can make 3D graphs such as cubes and cuboids. As before the length and the height are the x and y-axes, but the third dimension, the depth is called the \[z\]-axis.
Recently Updated Pages
Master Class 12 Business Studies: Engaging Questions & Answers for Success
Master Class 12 Chemistry: Engaging Questions & Answers for Success
Master Class 12 Biology: Engaging Questions & Answers for Success
Class 12 Question and Answer - Your Ultimate Solutions Guide
Master Class 11 English: Engaging Questions & Answers for Success
Master Class 11 Social Science: Engaging Questions & Answers for Success
Trending doubts
Which are the Top 10 Largest Countries of the World?
Draw a labelled sketch of the human eye class 12 physics CBSE
Differentiate between homogeneous and heterogeneous class 12 chemistry CBSE
In order to find out the different types of gametes class 12 biology NEET_UG
Why is the cell called the structural and functional class 12 biology CBSE
Draw ray diagrams each showing i myopic eye and ii class 12 physics CBSE